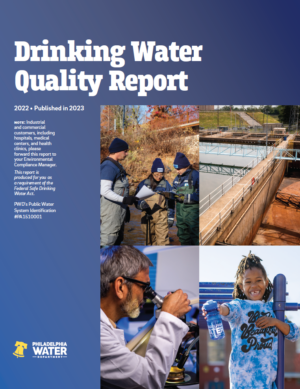
Drinking Water Quality Report
2022 • Published in 2023
Note: Industrial and commercial customers, including hospitals, medical centers, and health clinics, please forward this report to your Environmental Compliance Manager.
This report is produced for you as a requirement of the Federal Safe Drinking Water Act.
PWD’s Public Water System Identification
#PA1510001
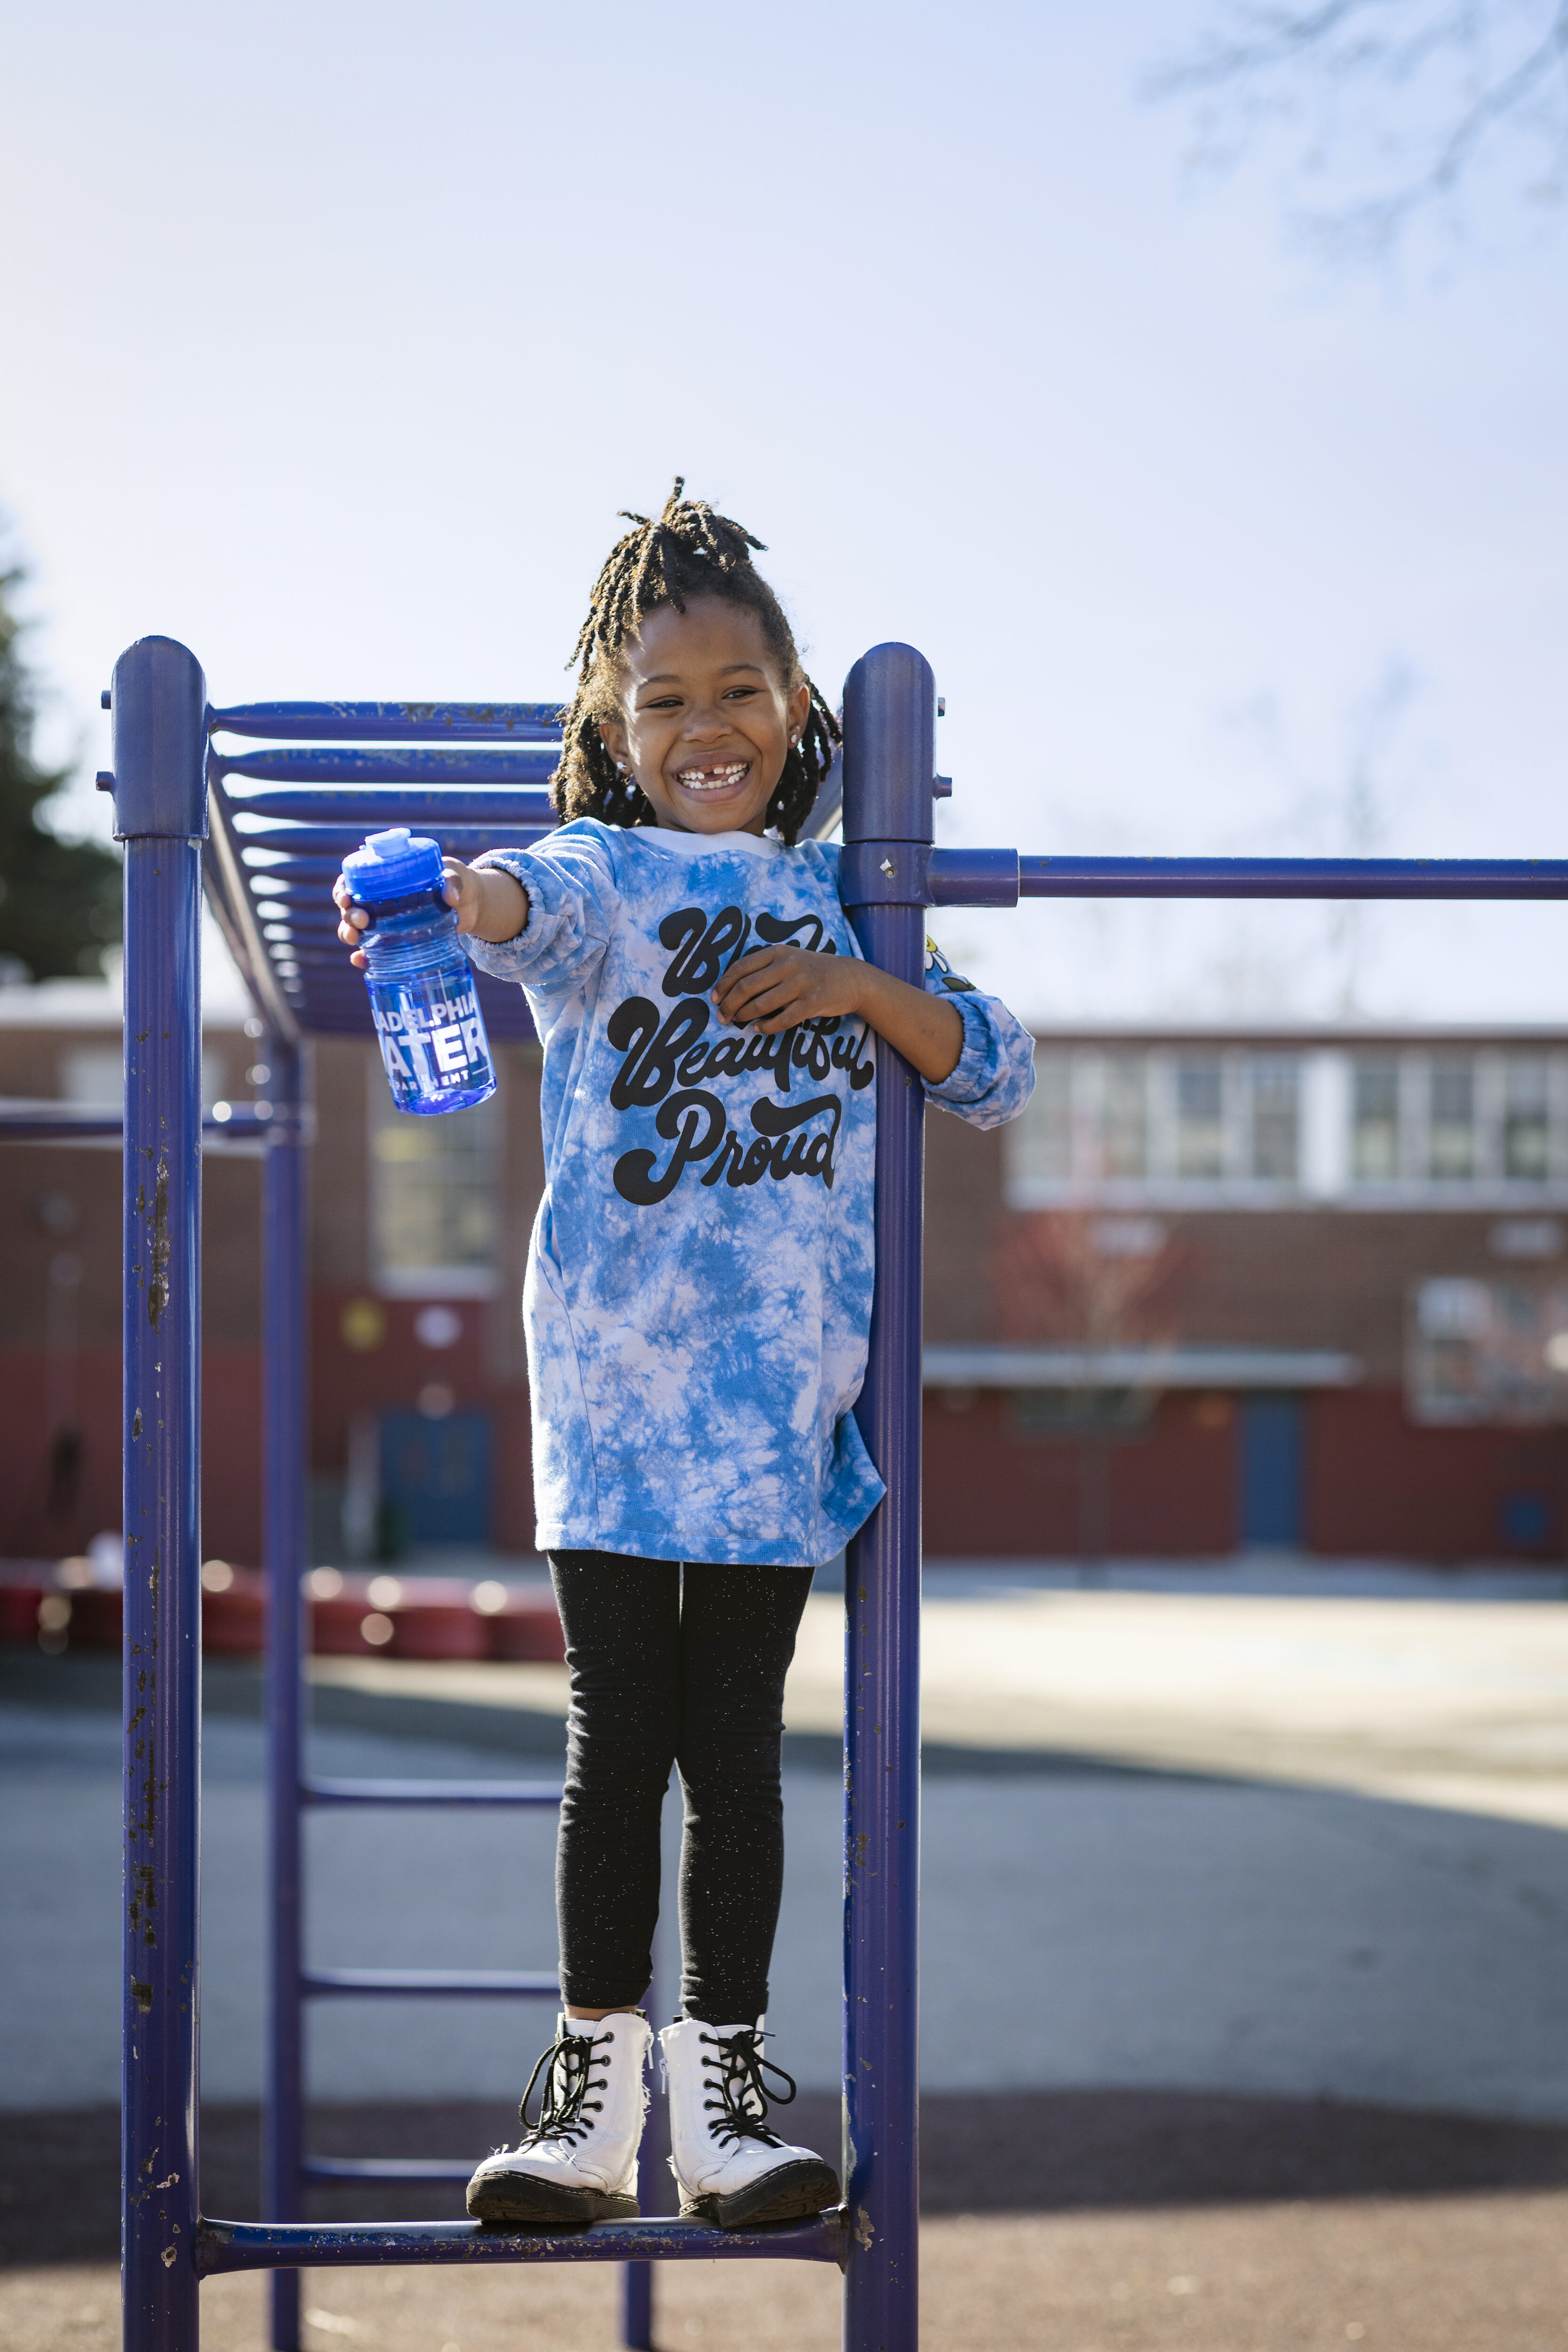
Your water is locally sourced
Water from our rivers is treated to the highest standards.
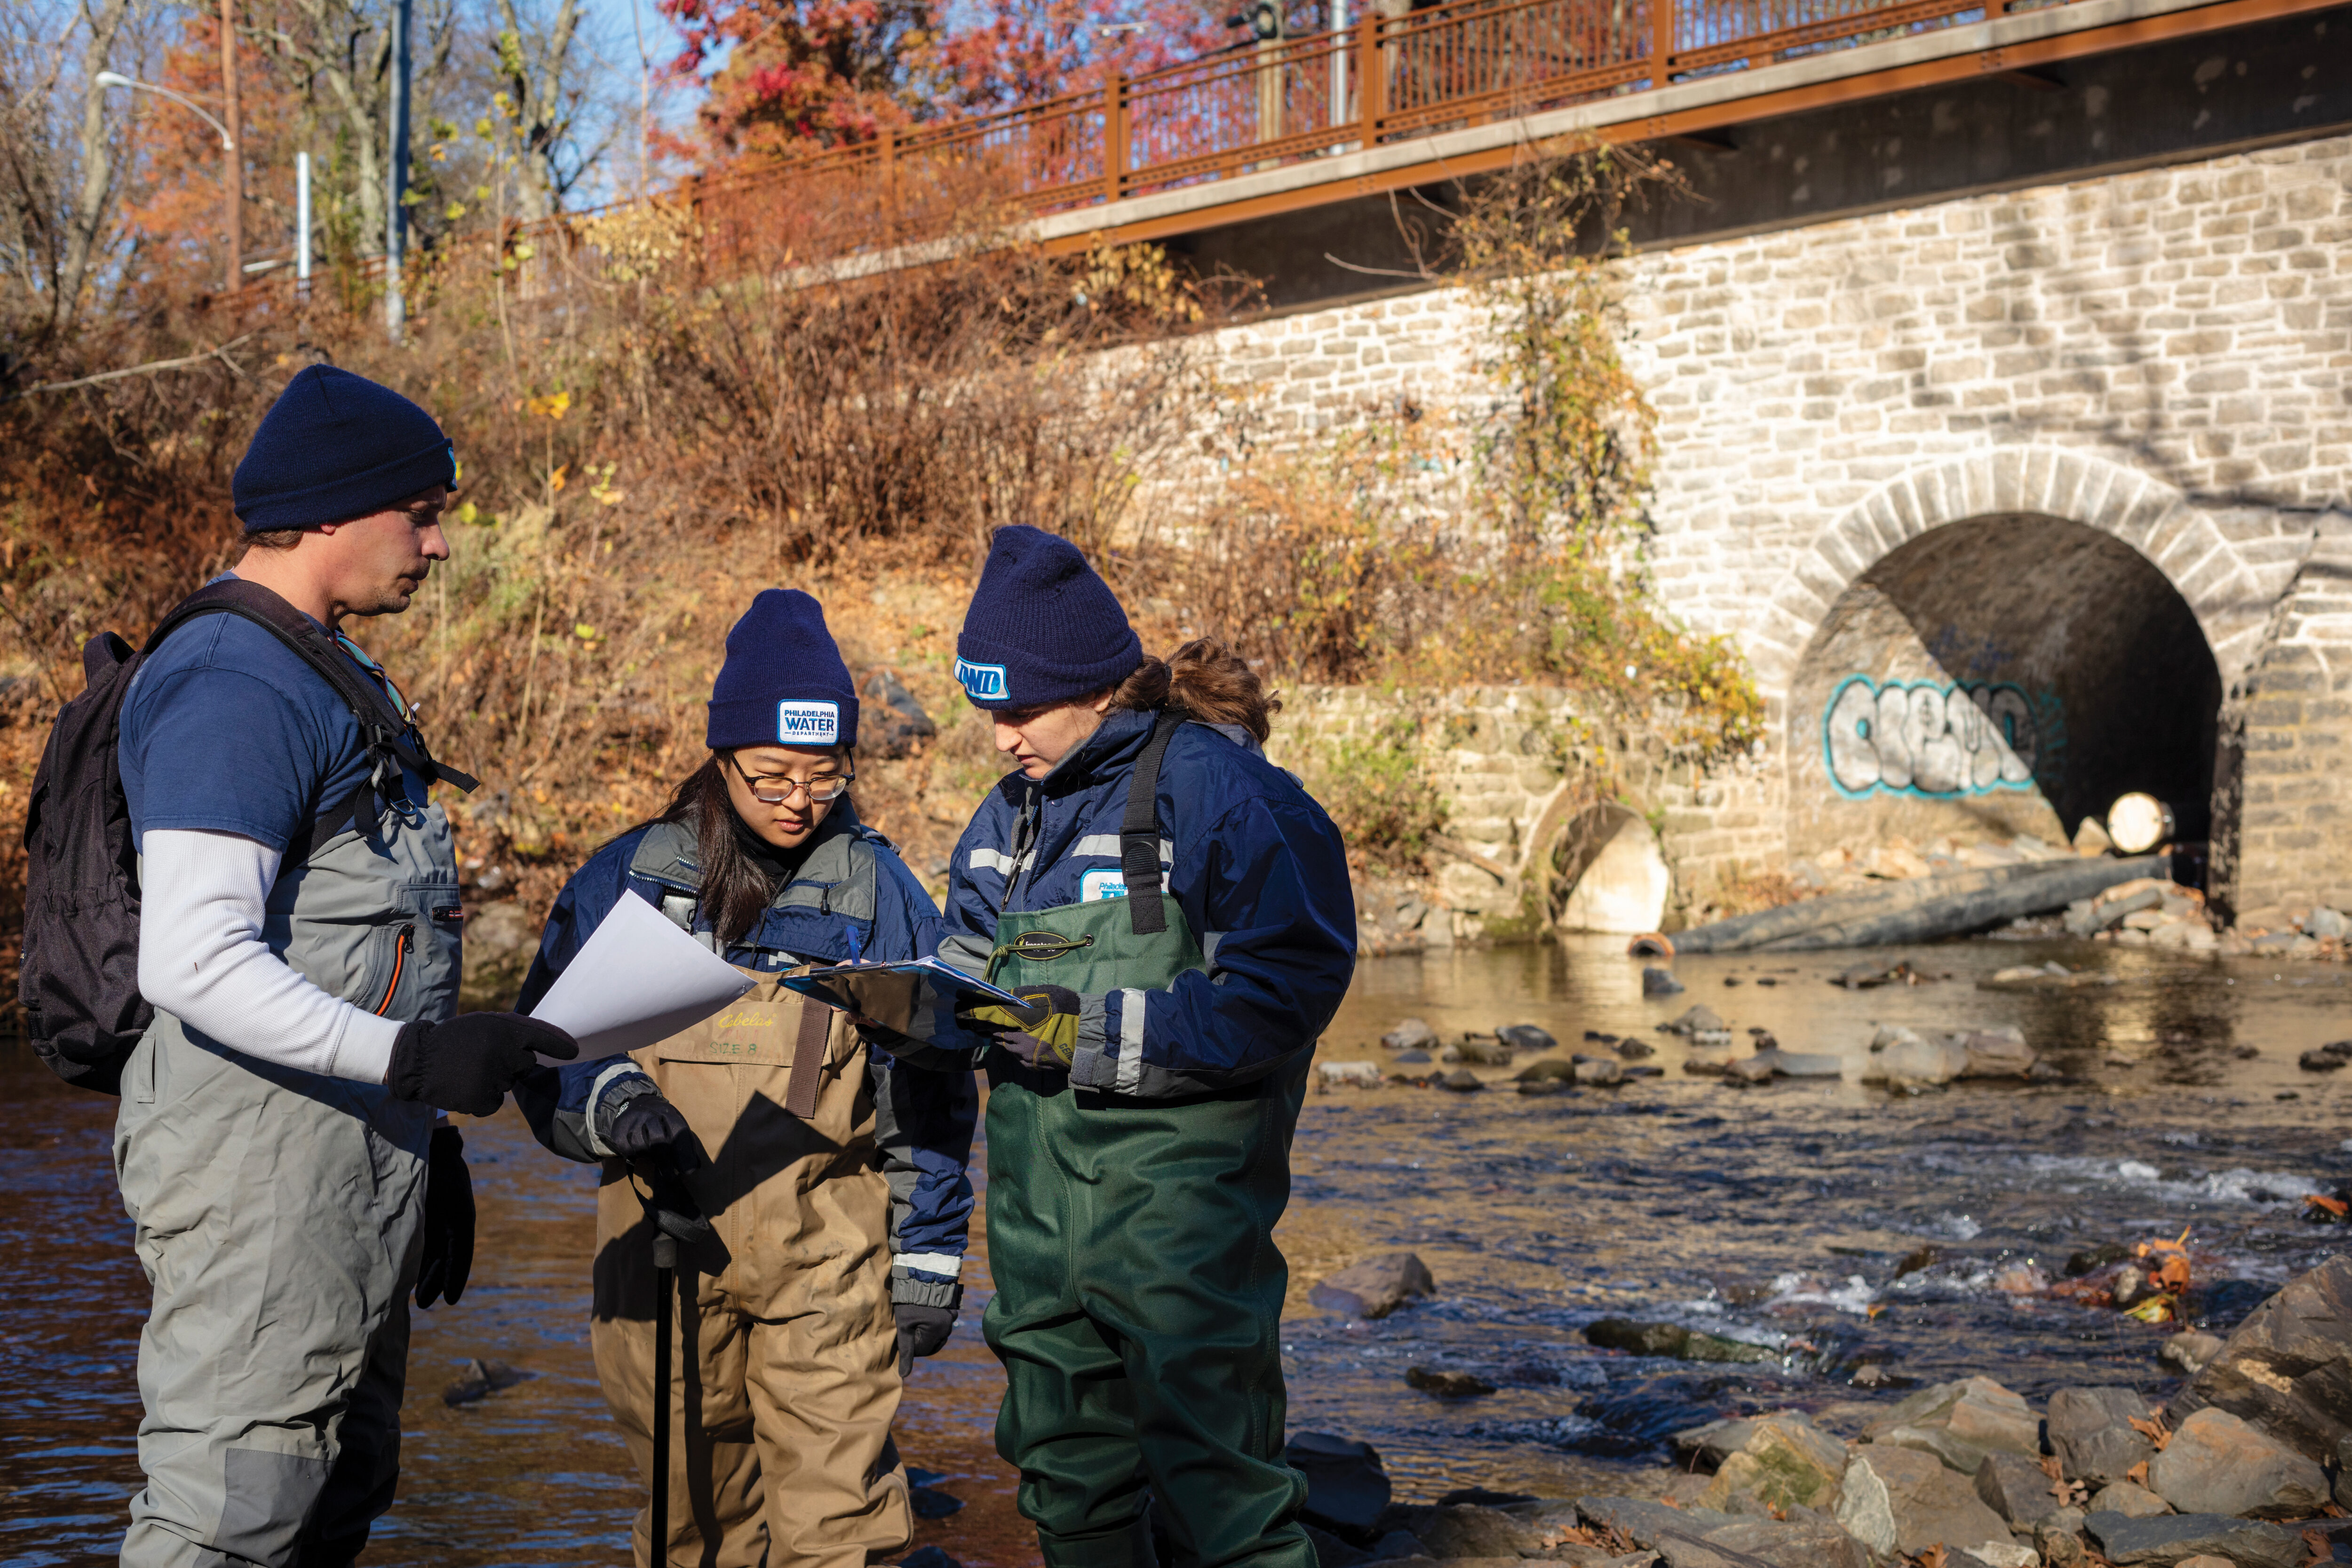
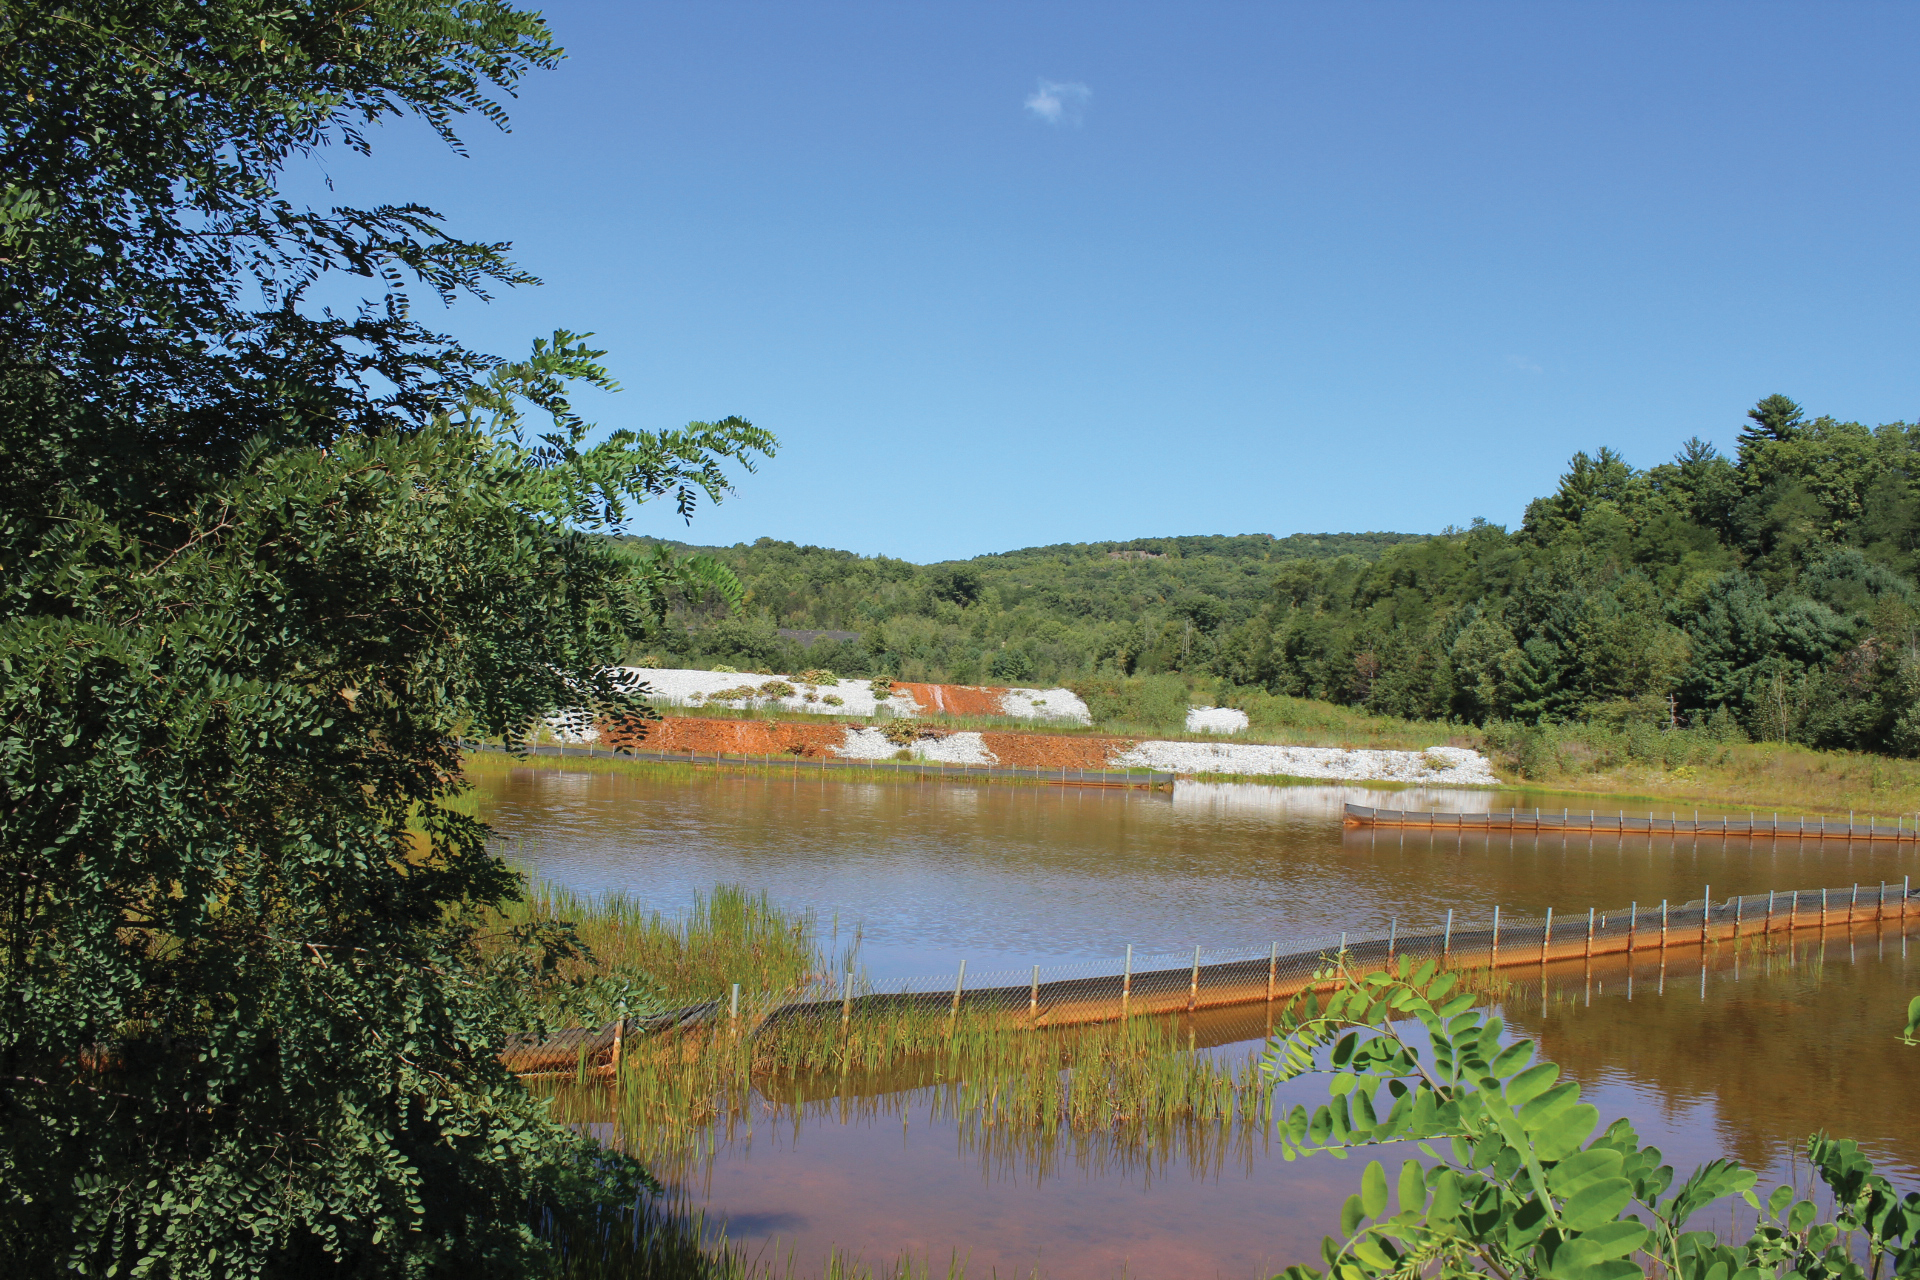
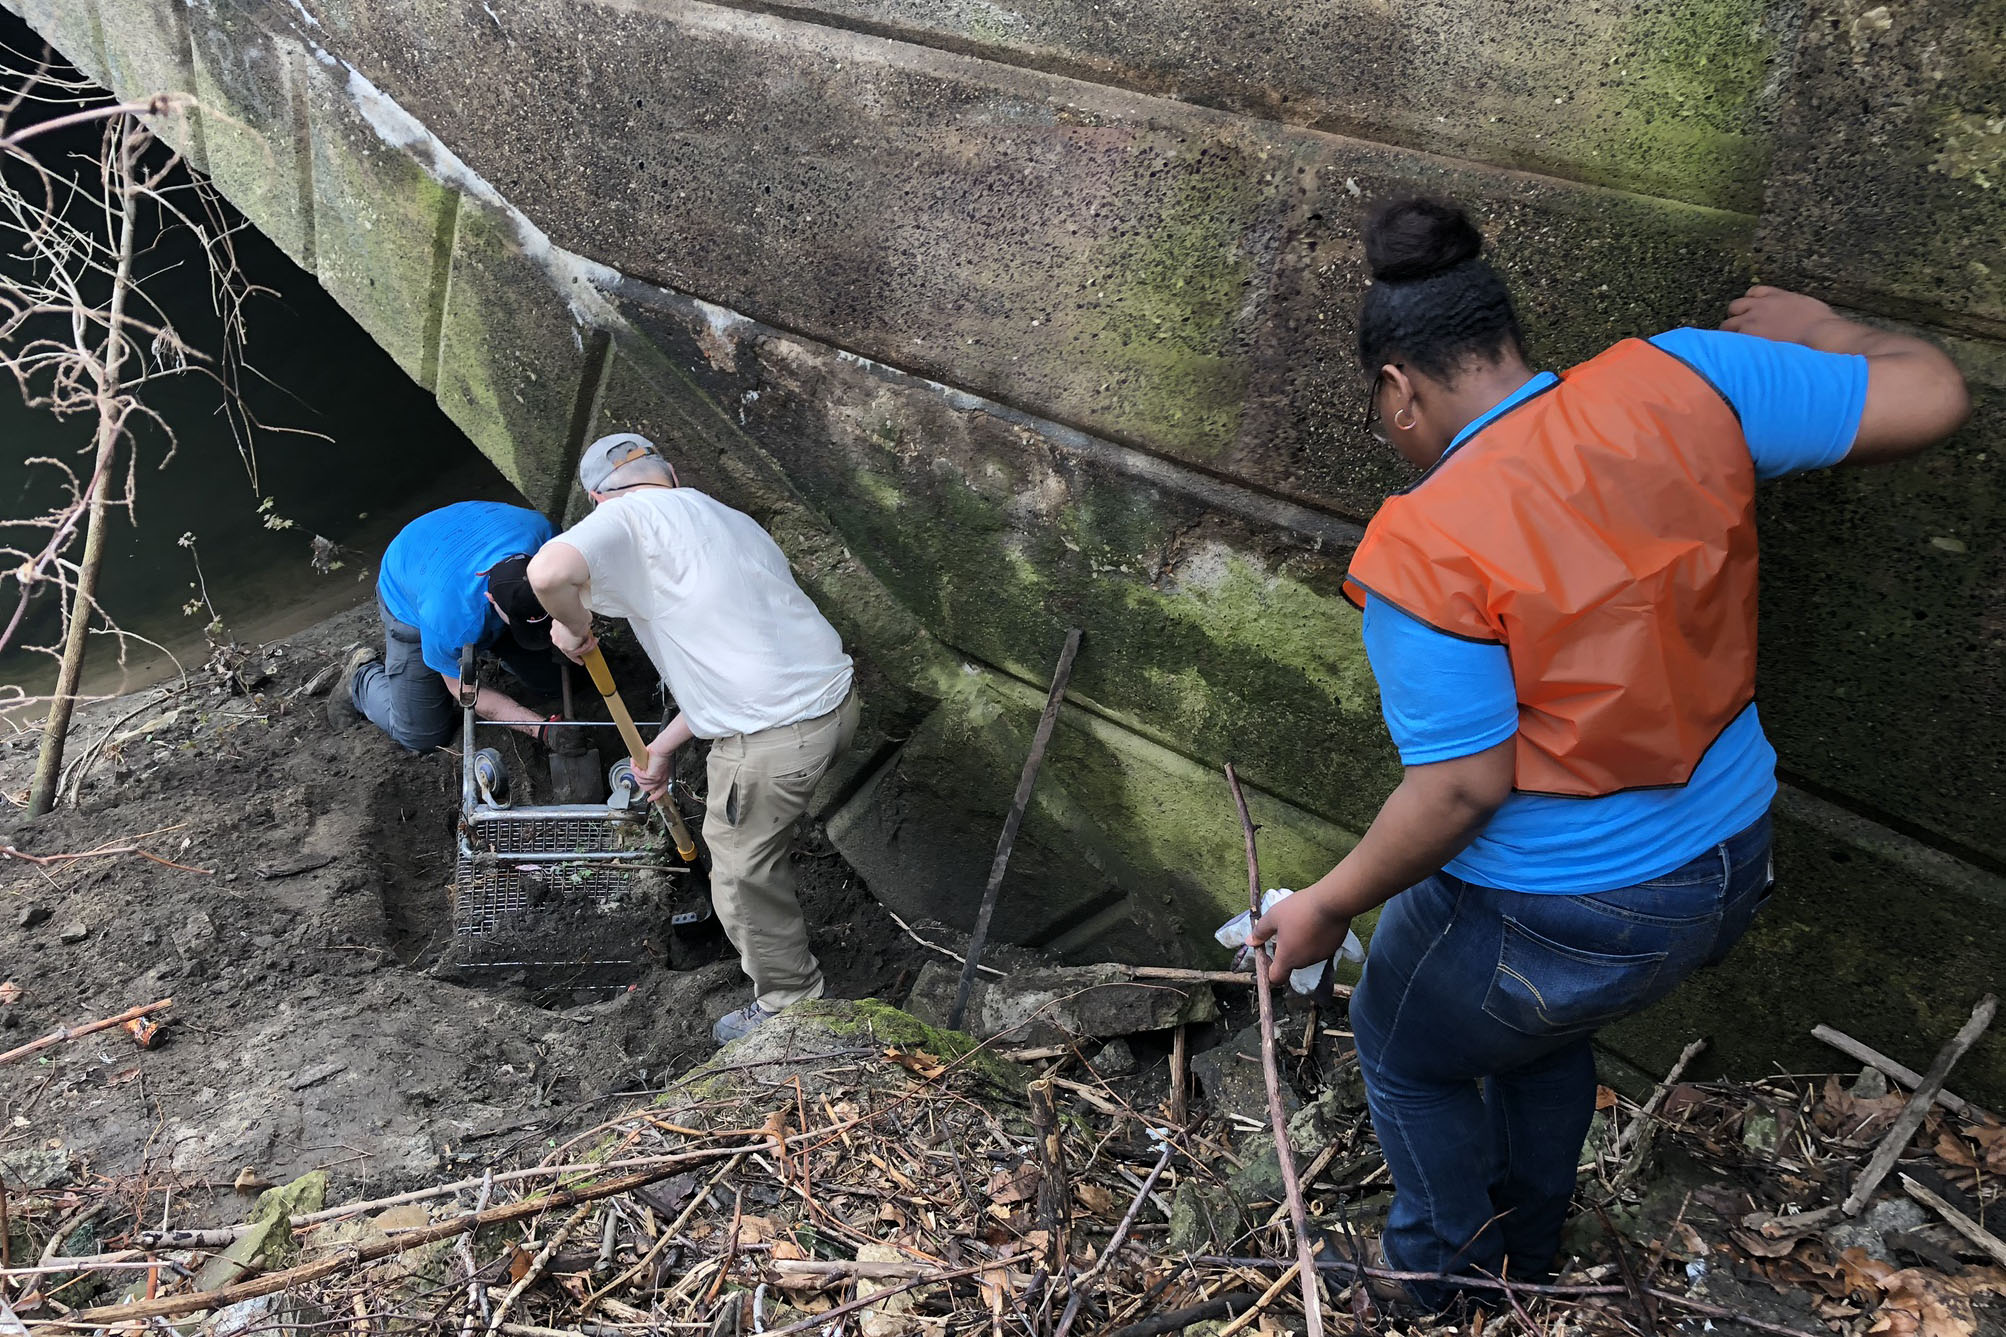
Above
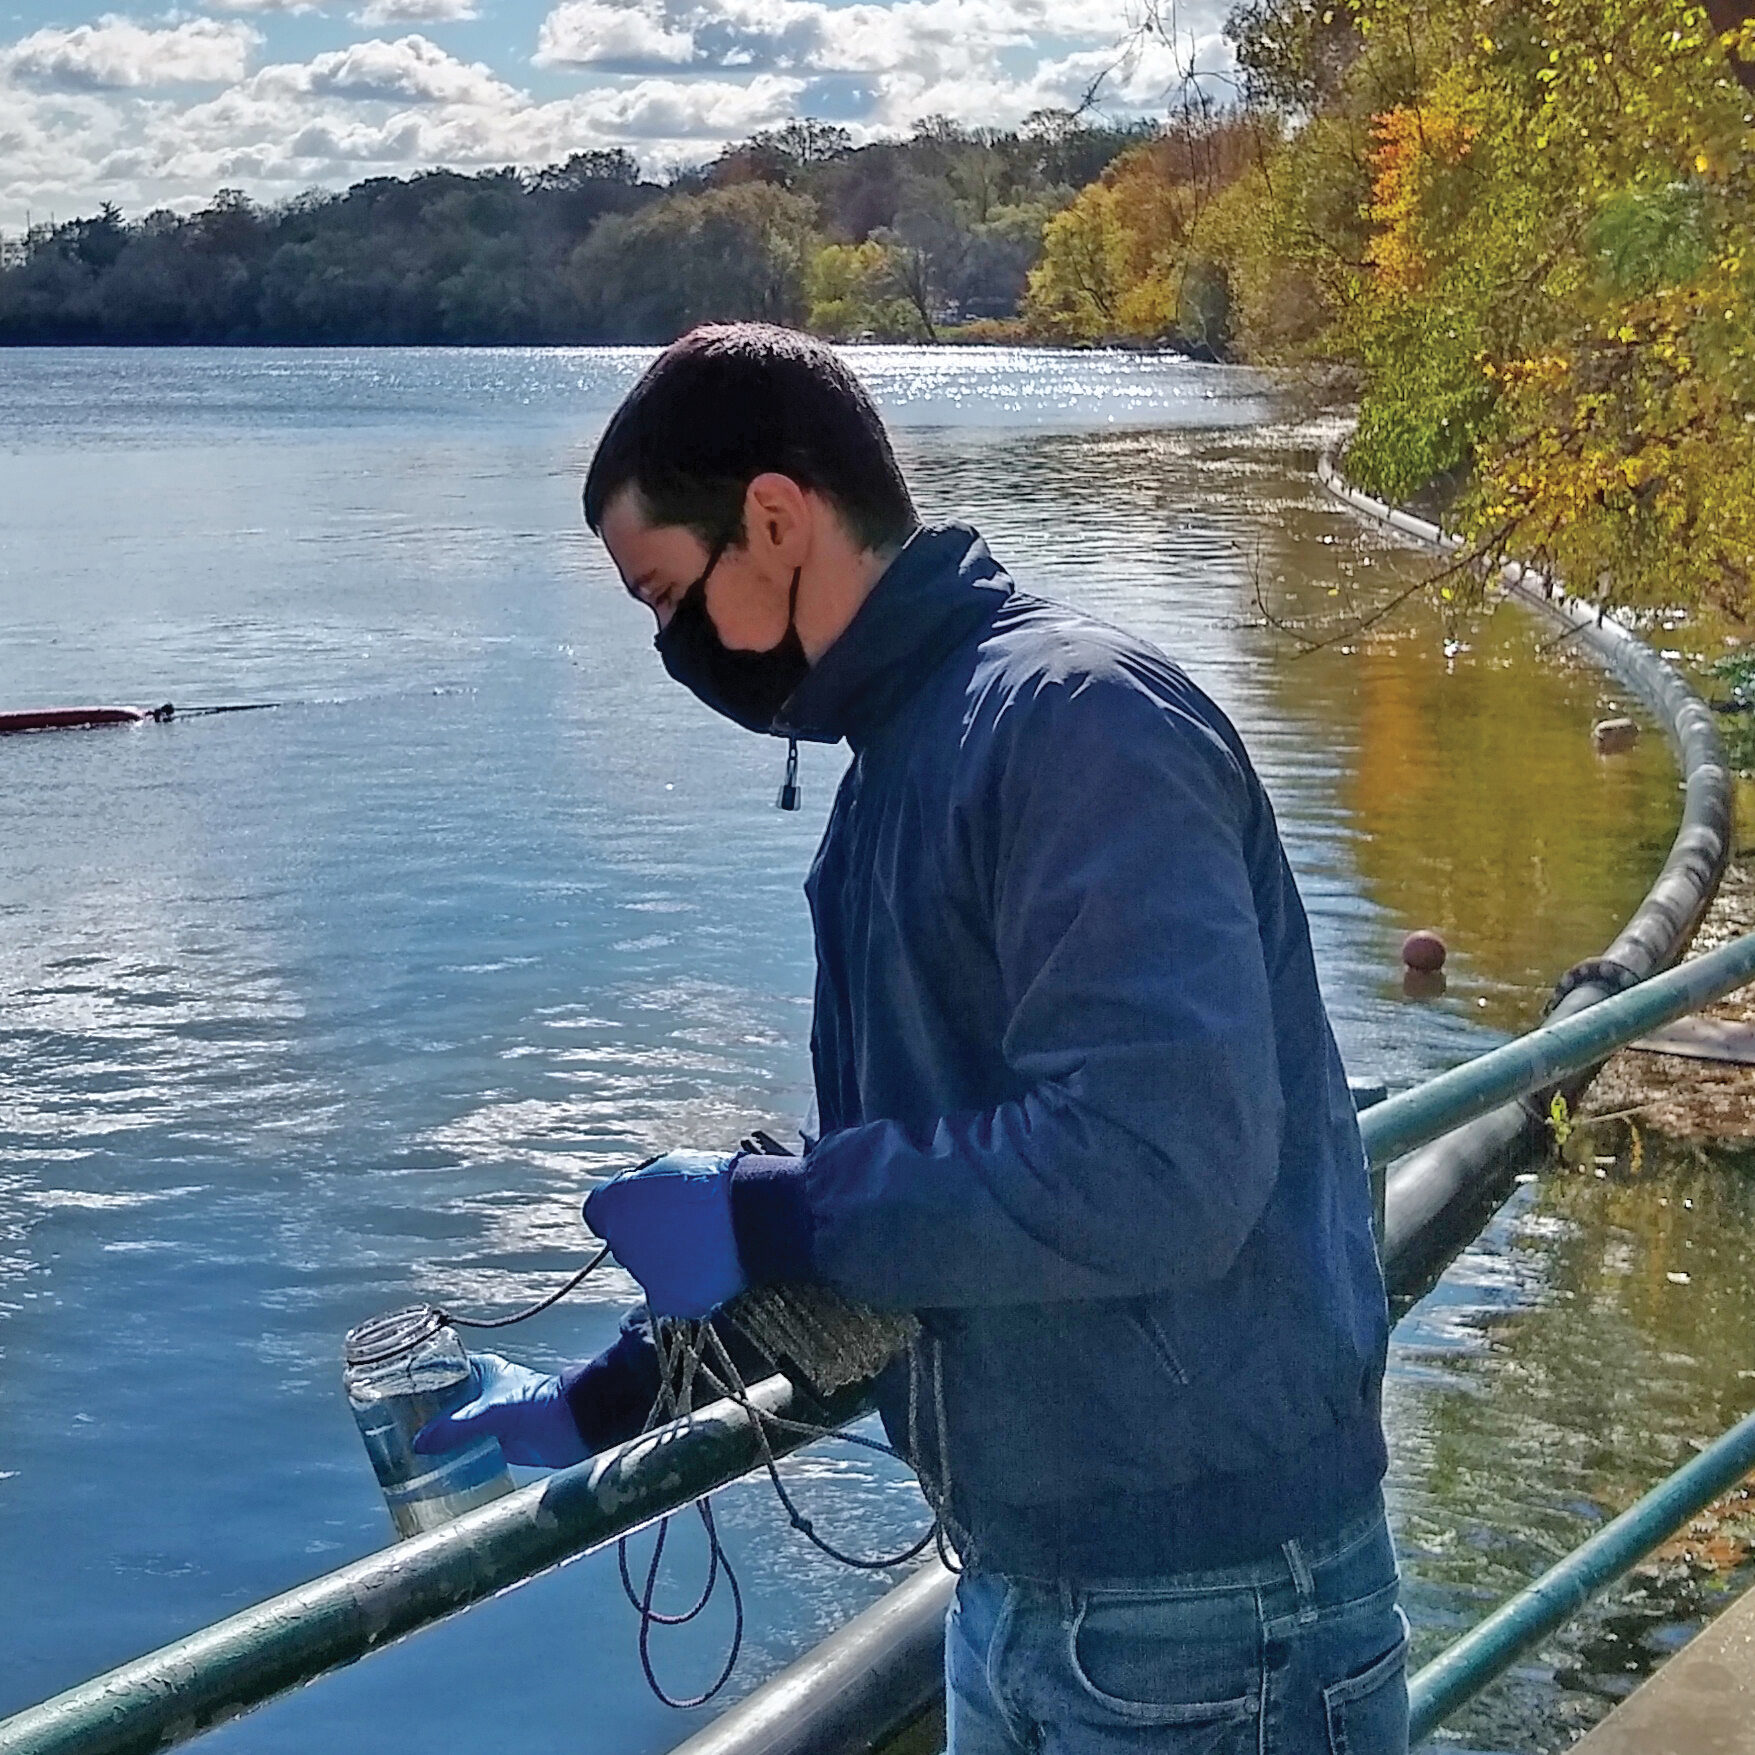
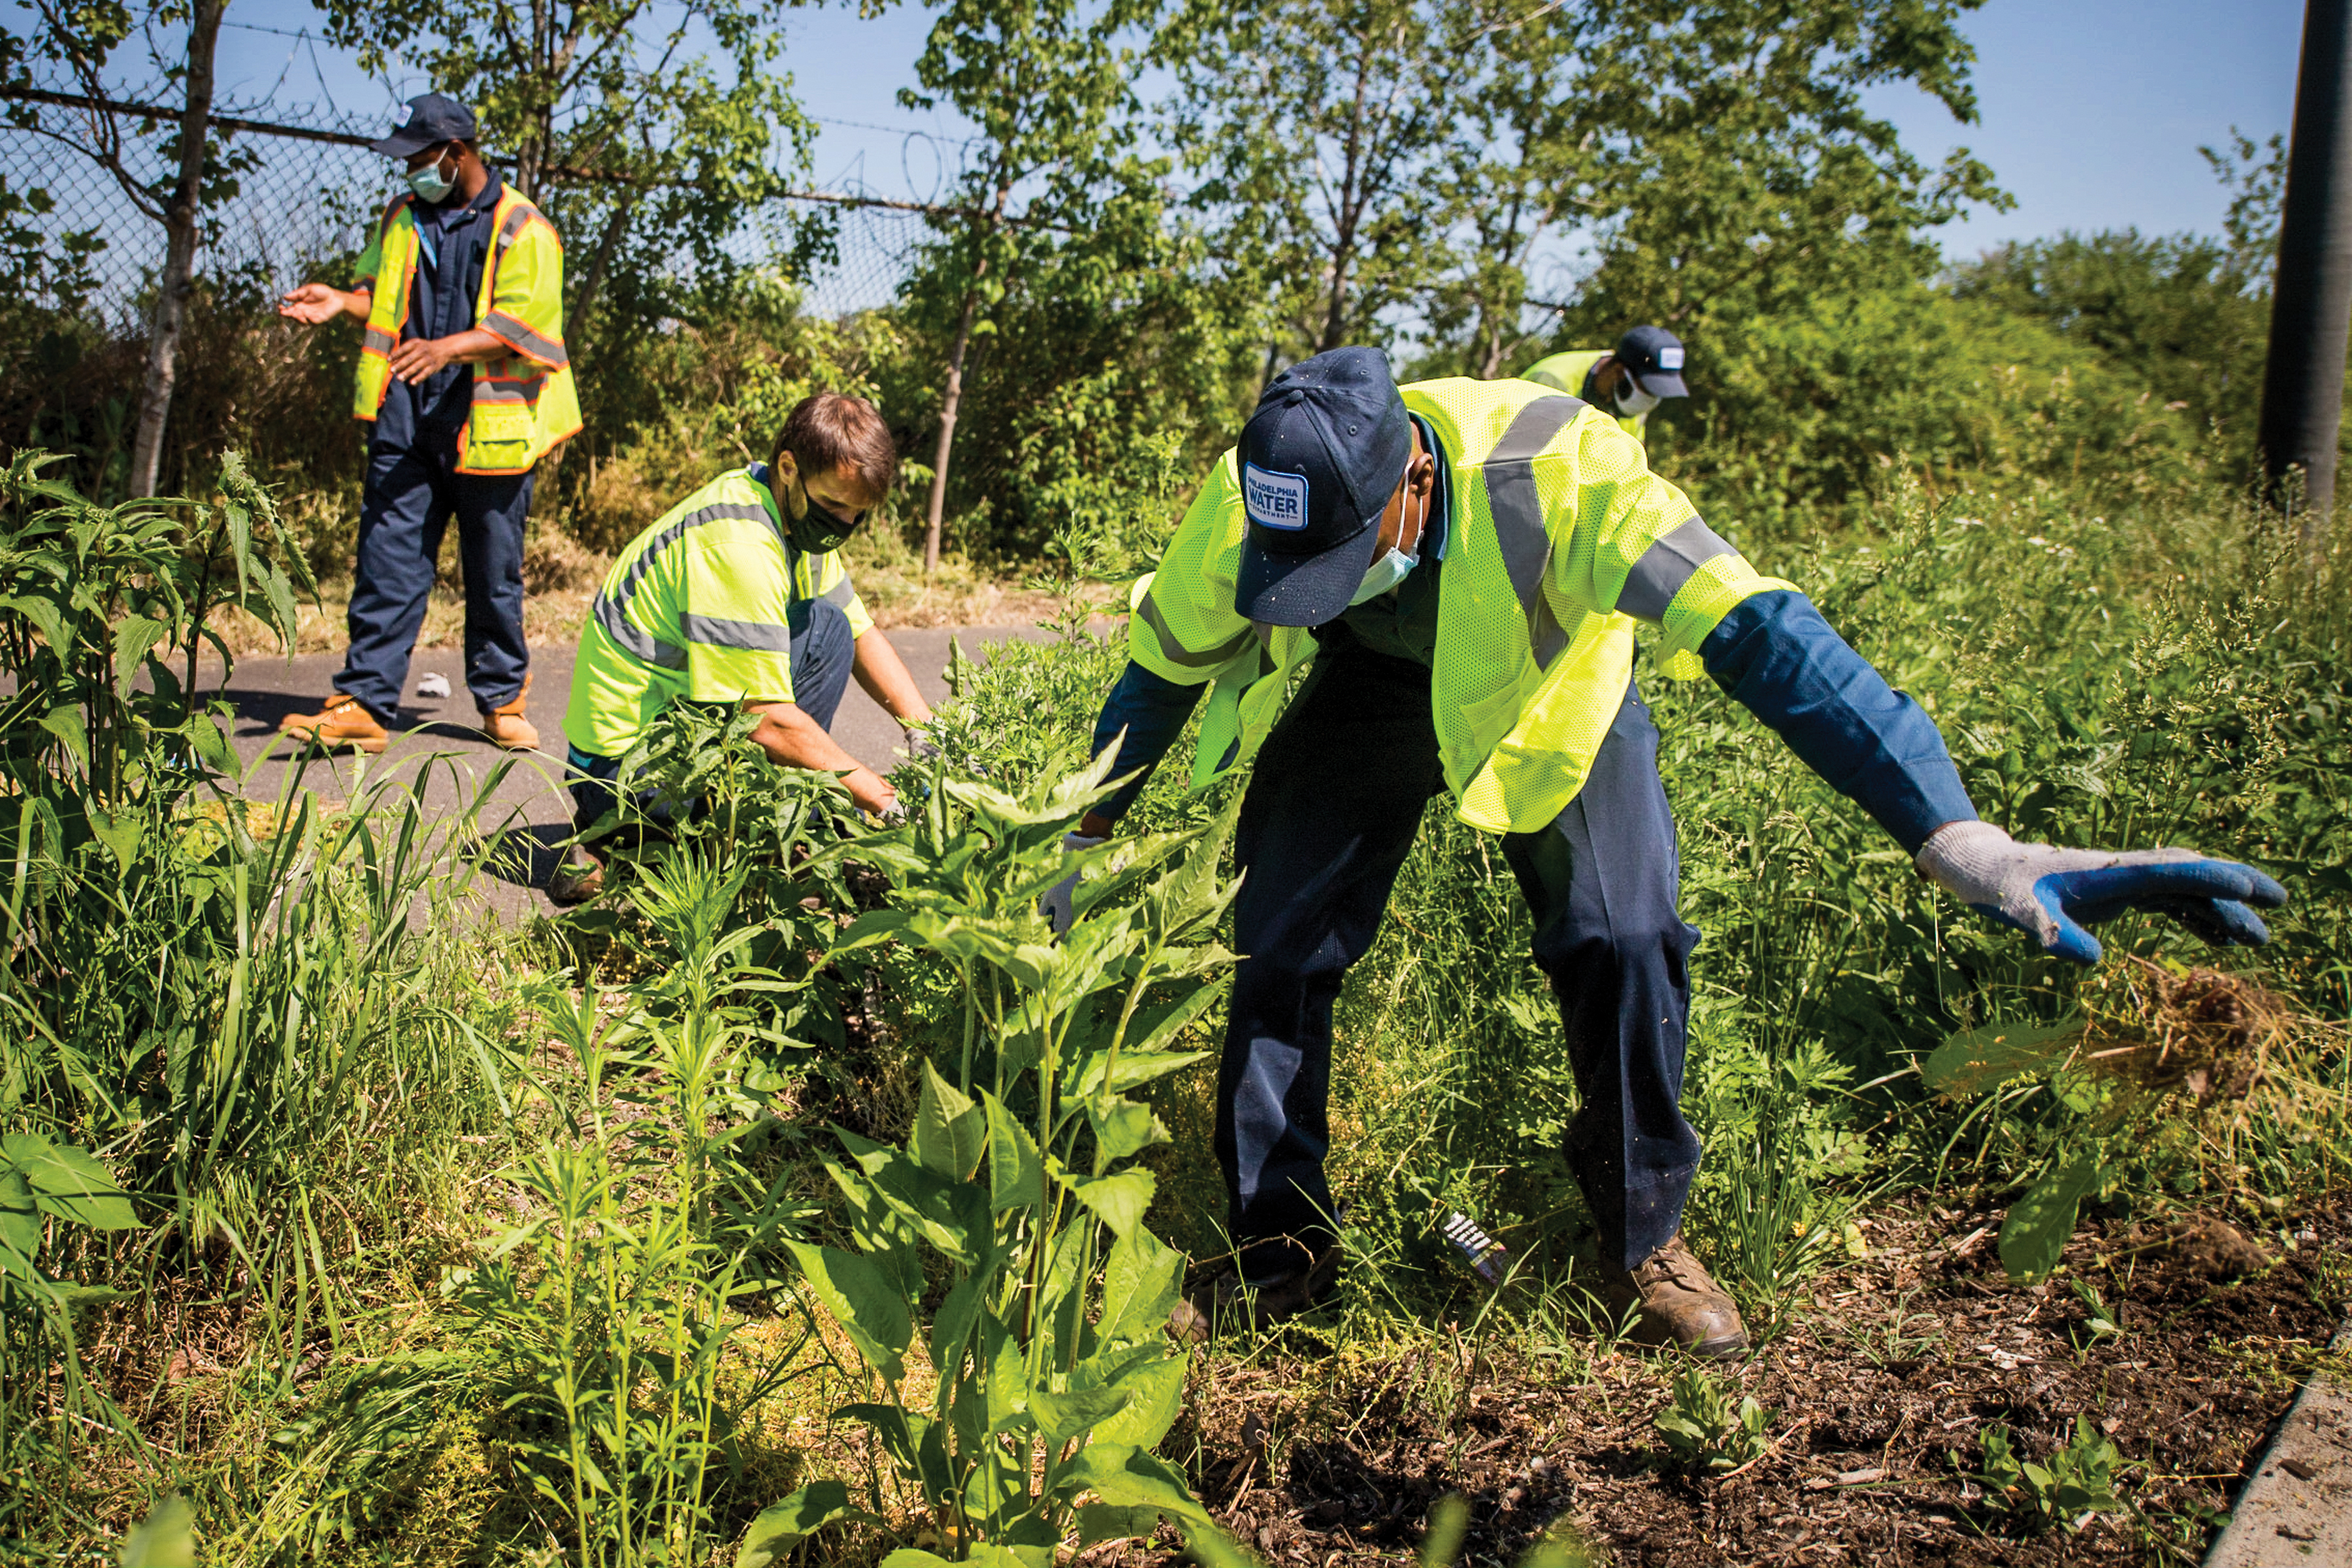
Water’s journey begins in the creeks and streams of our watershed. We partner with local organizations who help protect the source of our drinking water.
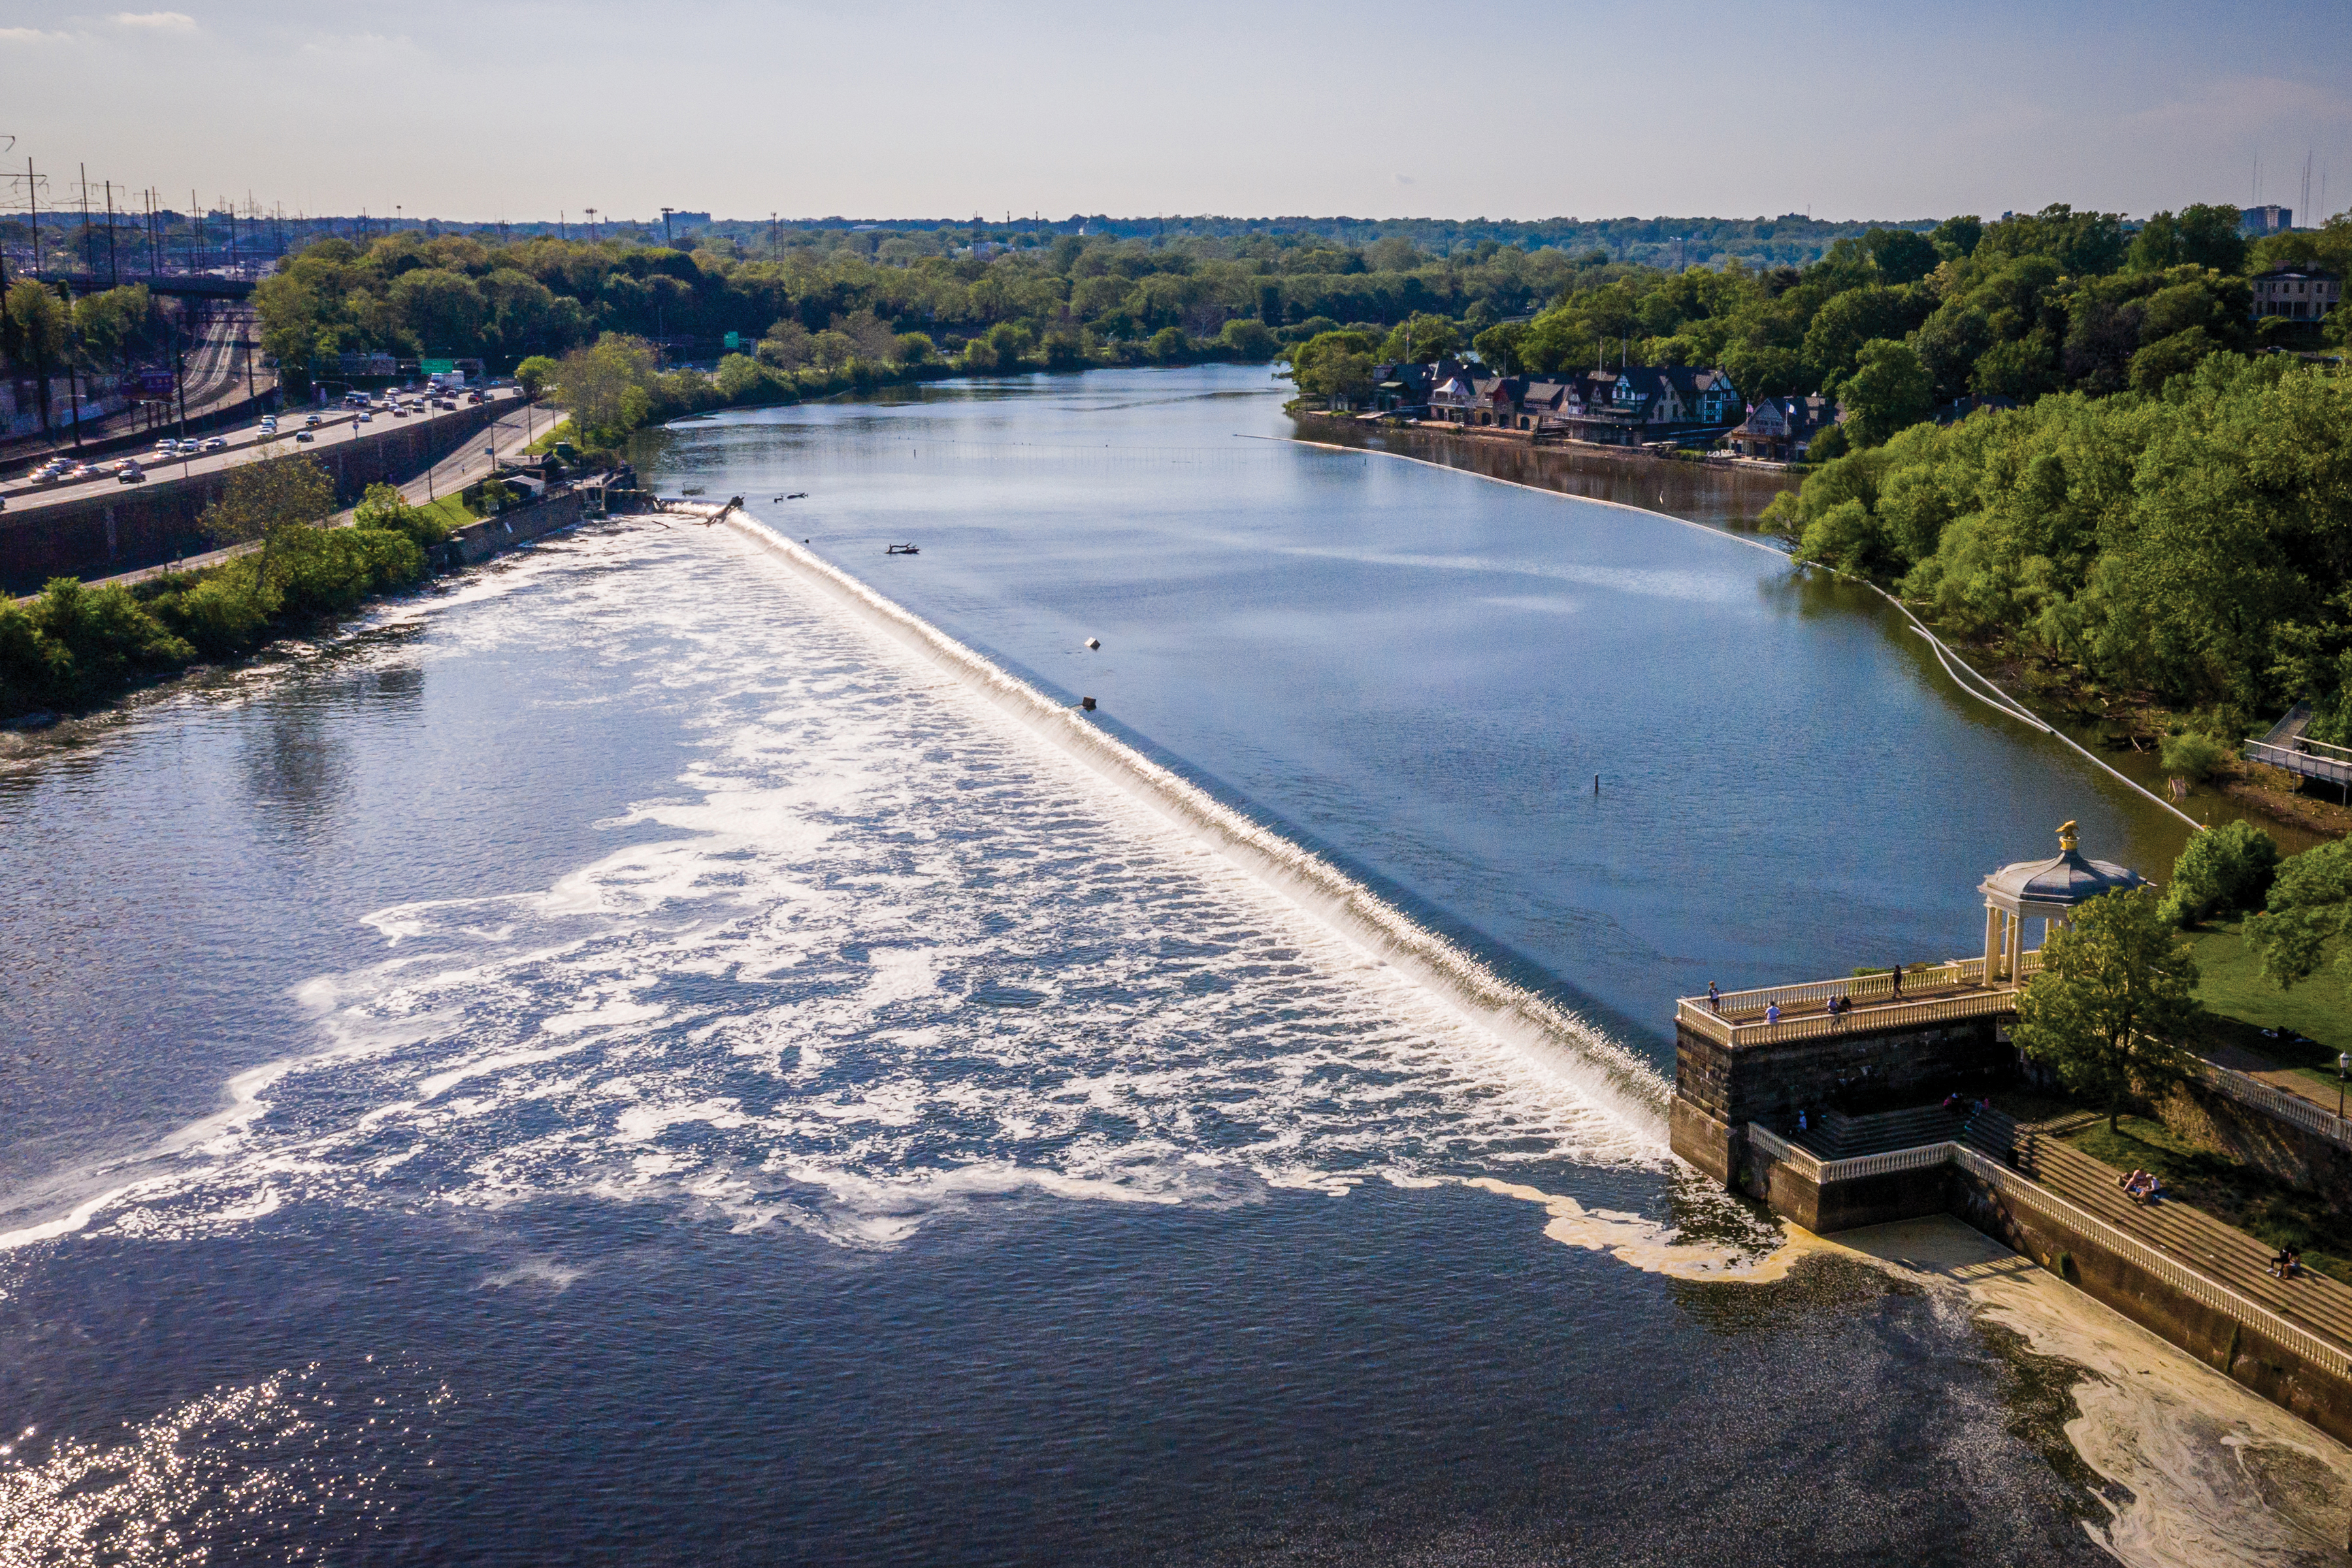
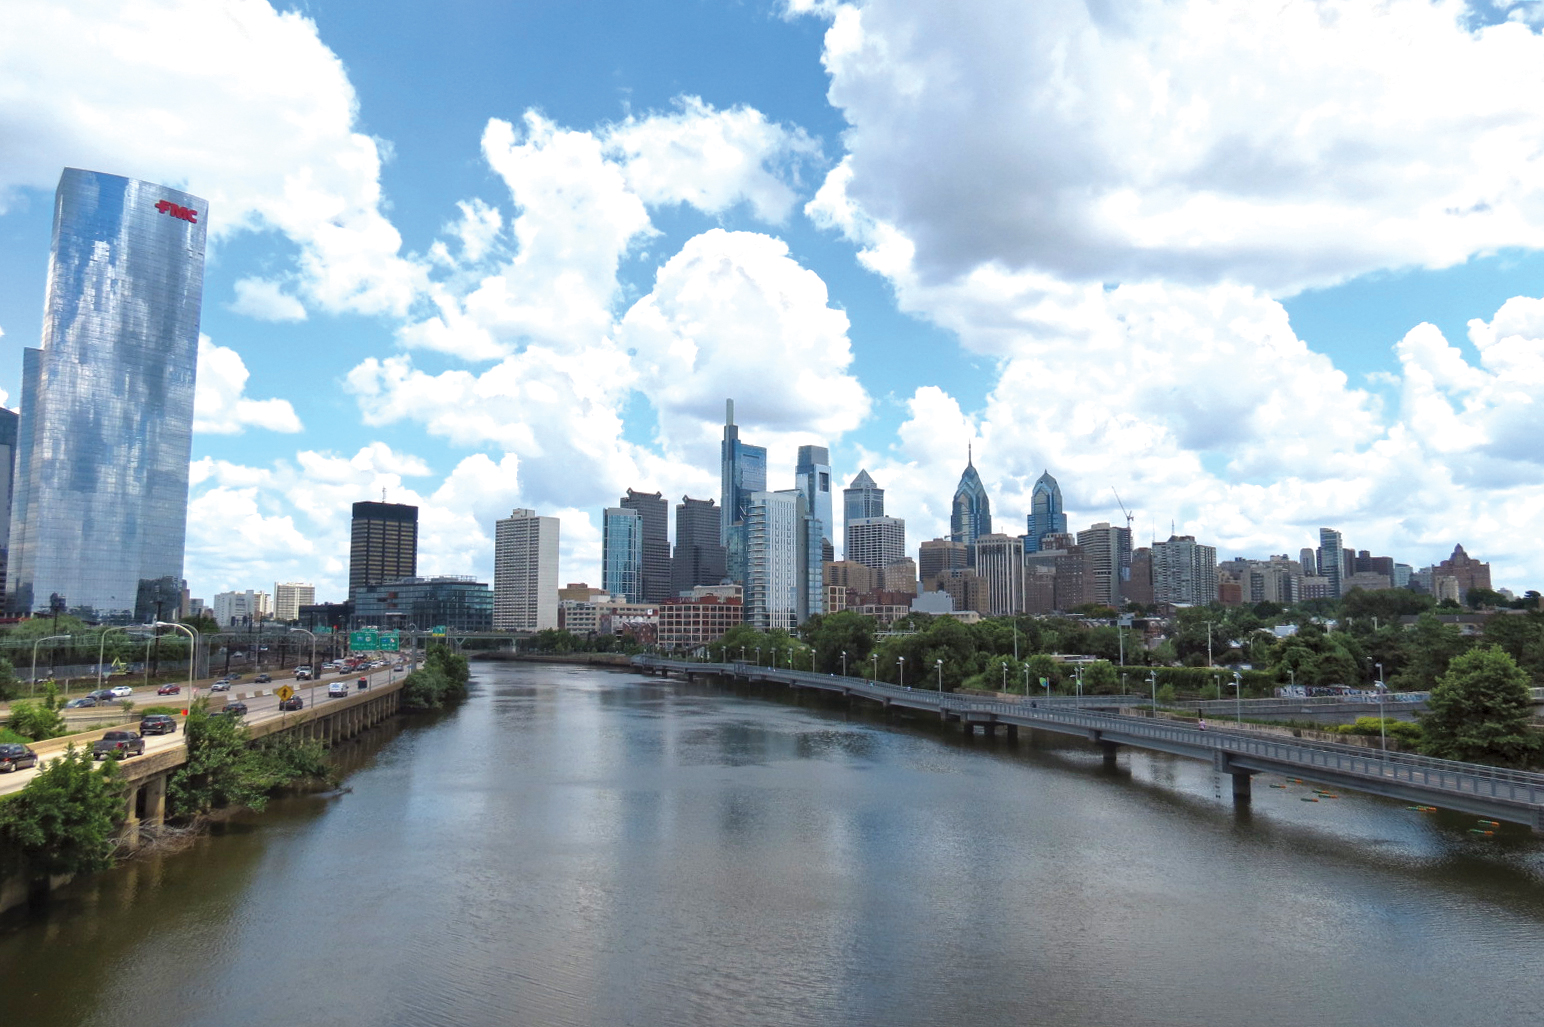
Below
The Schuylkill River (pictured) and the Delaware River provide the water we treat at our Drinking Water Treatment Plants.
Sharing this report
➤ water.phila.gov/2022-quality
Please share this report with all people who drink this water, especially those who may not have received this notice directly (for example, people in apartments, nursing homes, schools and businesses). You can do this by posting this notice in a public place or distributing copies by hand and mail.
To receive a printed copy of this report, please email: waterquality@phila.gov
More from us:

A message from the Commissioner
Delivering clean tap water is our top priority.
In March 2023, Philadelphia experienced a frightening reminder of just how valuable clean water is when a chemical spill occurred on the Delaware River just outside of the city.
Making sure we can rely on clean tap water is what drives the Philadelphia Water Department. It’s why we have a longstanding and extensive water quality monitoring program that enabled us to determine with confidence that our water remained safe throughout the incident. It’s also why we created and continually improve the Delaware Valley Early Warning System, which alerted the region of the spill and allowed Philadelphia to respond rapidly. Read about that system on page 7.
Our expert staff of scientists, engineers, and plant operators know our water and the rivers better than anyone, and they stepped up in this emergency. While the results from our sampling after the spill are not part of this annual report (visit water.phila.gov/spill for that data), the same science and expertise that protects our water and assures safety daily kept us safe following the March 2023 incident.
Every day, more than a million Philadelphia residents get clean, quality water from the Delaware River, with the rest of the city depending on the Schuylkill. We, of course, rely on this water for drinking, cooking, washing, and other essential daily activities.
In this report, you will find the results of the testing we do around the clock. Please read through these pages and learn about all we do to protect our city.
The employees of the Philadelphia Water Department live in Philadelphia, and we drink the water we deliver to our customers. We know how important clean tap water you can trust is, and we work to ensure it’s available when you need it.
Sincerely,
Randy E. Hayman, Esq.
Water Commissioner
Contact Information
Philadelphia Water Department
1101 Market St.
Philadelphia, PA 19107
Public Water System ID #PA1510001
Brian Rademaekers
Public Information Officer, Public Affairs
(215) 380-9327
How this document is organized
This story follows our water quality work from source and treatment through delivery to your home.

Part One: Source & Treatment
Philly’s local water sources—and what we do to keep water safe
Part Two: Delivery
Safe transit through the system
Part Three: At Home
The final stretch to your tap
2022 Data Tables & More
Look for these quick guides throughout the report:
A Closer Look 

Charts and graphs let you see the data in a new way. ![]()
Here’s the story of why we do this test
Handwritten notes explain how and why we do these tests. ![]()
☑ RESULT:
All results are better than the recommended federal levels.
Look here for key takeaways. ![]()
Part One: Source & Treatment
We take water from the Delaware River at one of our three treatment plants in Philadelphia
Your water begins in freshwater streams
Philadelphia’s water comes from the Delaware River Watershed. The watershed begins in New York State and extends 330 miles south to the mouth of the Delaware Bay. The Schuylkill River is part of the Delaware River Watershed.
Protection starts at the sources.
We take a holistic approach, beginning with Philadelphia’s water supply. We monitor waterways across the watershed and look for potential sources of contamination. We keep track of water availability and flow.
Our wide range of tools for protecting water sources includes:
Research
- We study regional influences, such as natural gas drilling, and global influences like sea level rise.
Projects in the field
- We protect against stormwater and agricultural runoff.
- We monitor water contaminants.
Partnerships
- We team up with organizations across the region to protect our entire watershed.
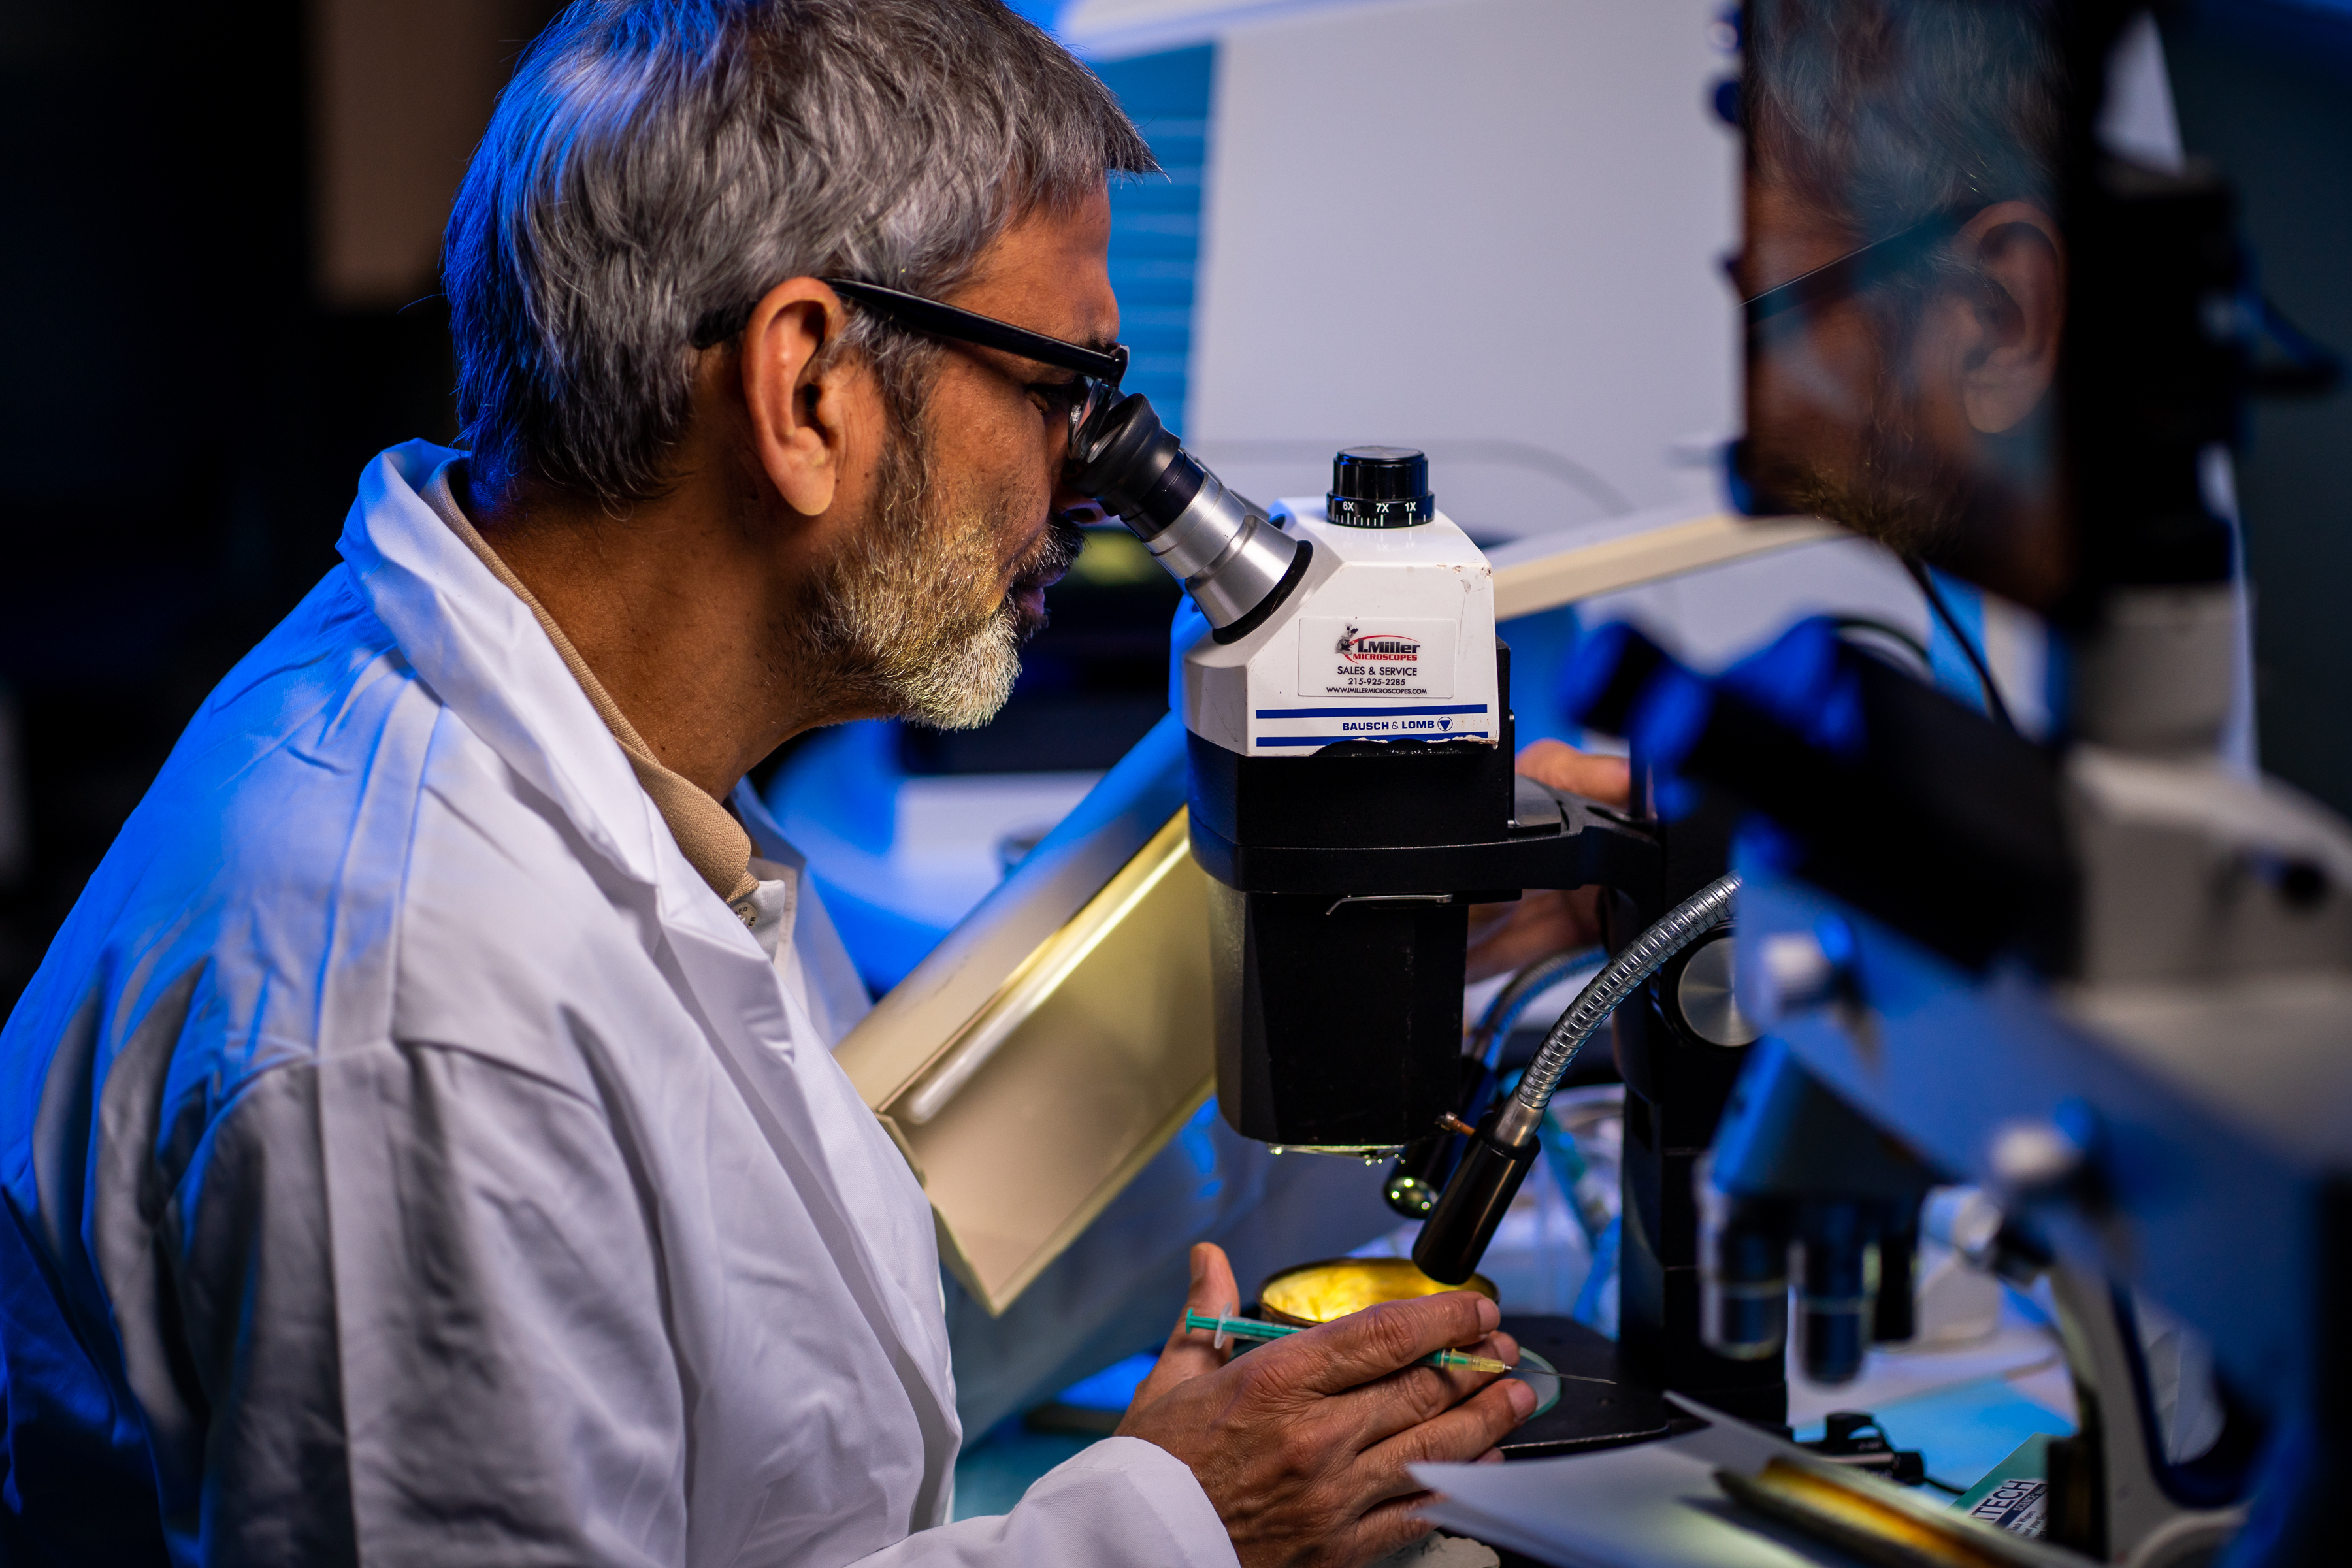
Monitoring source water to promote health and safety
Per- and polyfluoroalkyl substances (PFAS) are potentially harmful chemicals that have been used in industry and many consumer products. We study PFAS in the city’s rivers, creeks, and finished water.
Cryptosporidium, a microscopic organism sometimes found in freshwater, can cause illness in humans. We are one of the nation’s leaders in Cryptosporidium research. We work closely with the Philadelphia Department of Public Health to ensure our tap water is free of Cryptosporidium and other organisms.
Spotlight:
Delaware Valley Early Warning System (EWS)
Reducing emergency response times by communicating across the area.
Our drinking water is a resource shared by millions of people in towns and cities across the region. The Delaware Valley Early Warning System (EWS) protects drinking water by providing rapid notifications to organizations and utilities like PWD.
The Web-based emergency communication system reports events like truck and freight accidents and chemical spills that may impact our source water.
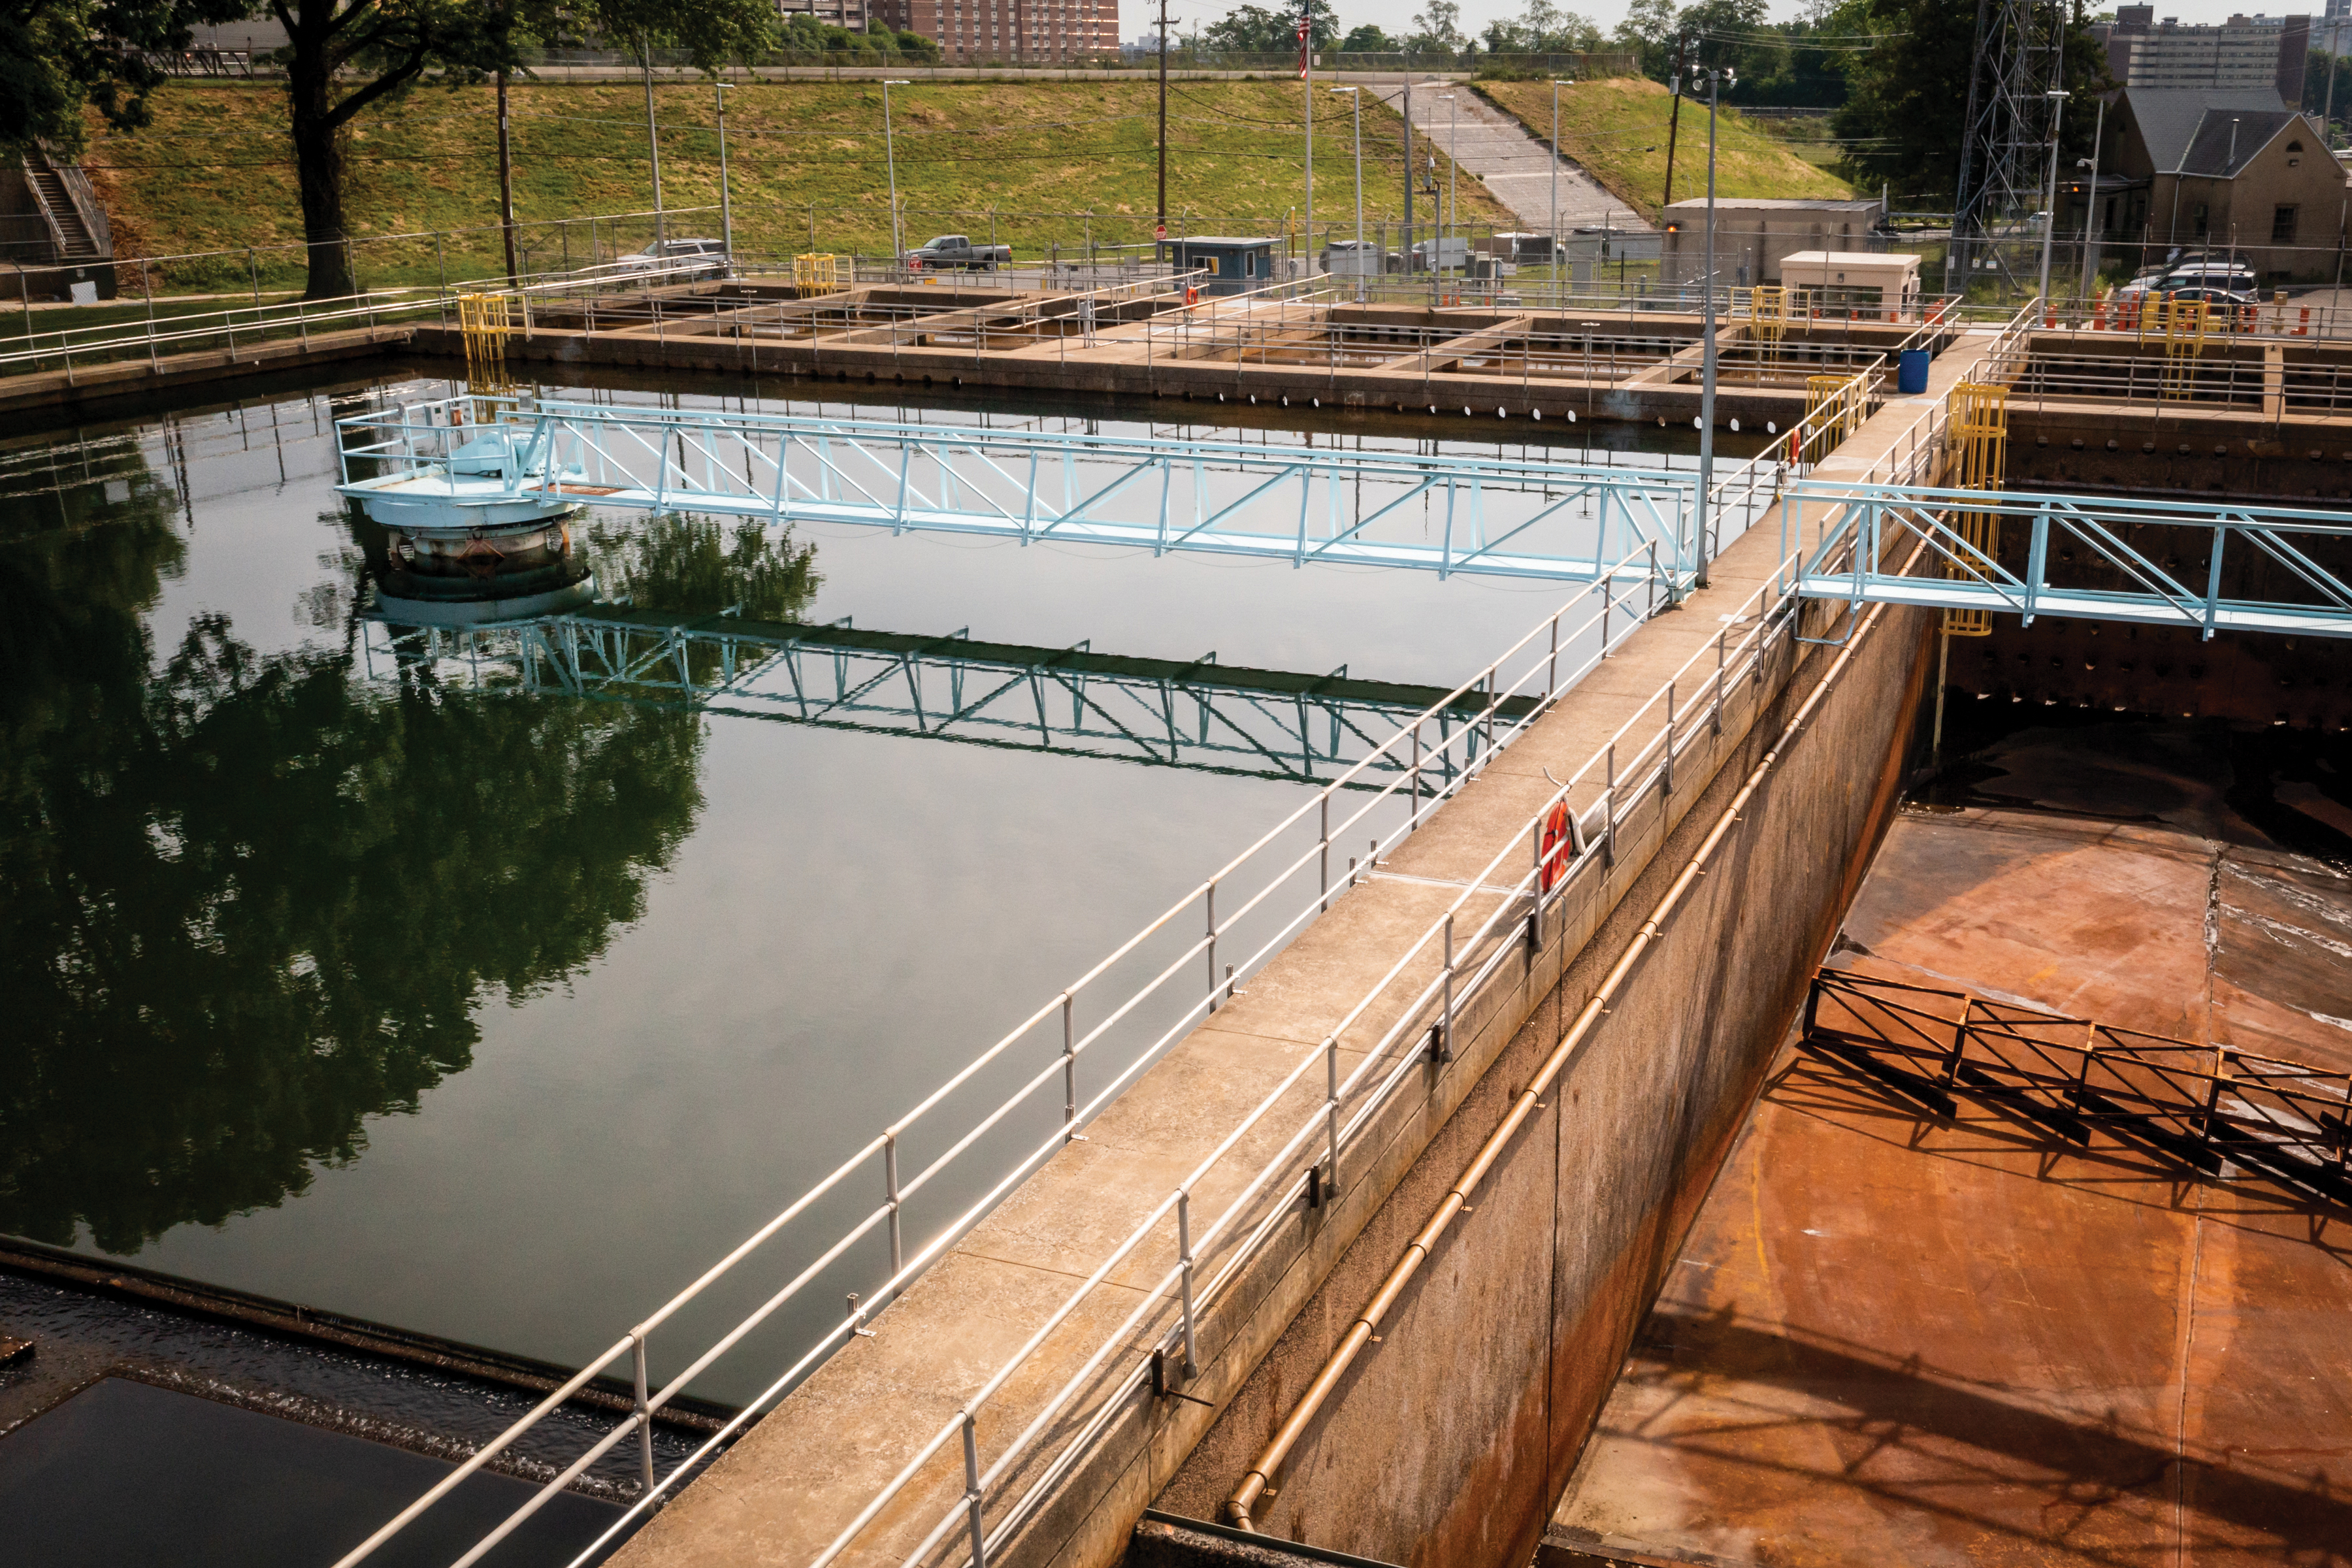
Drinking Water Treatment Plants:
An important early step in water’s journey.
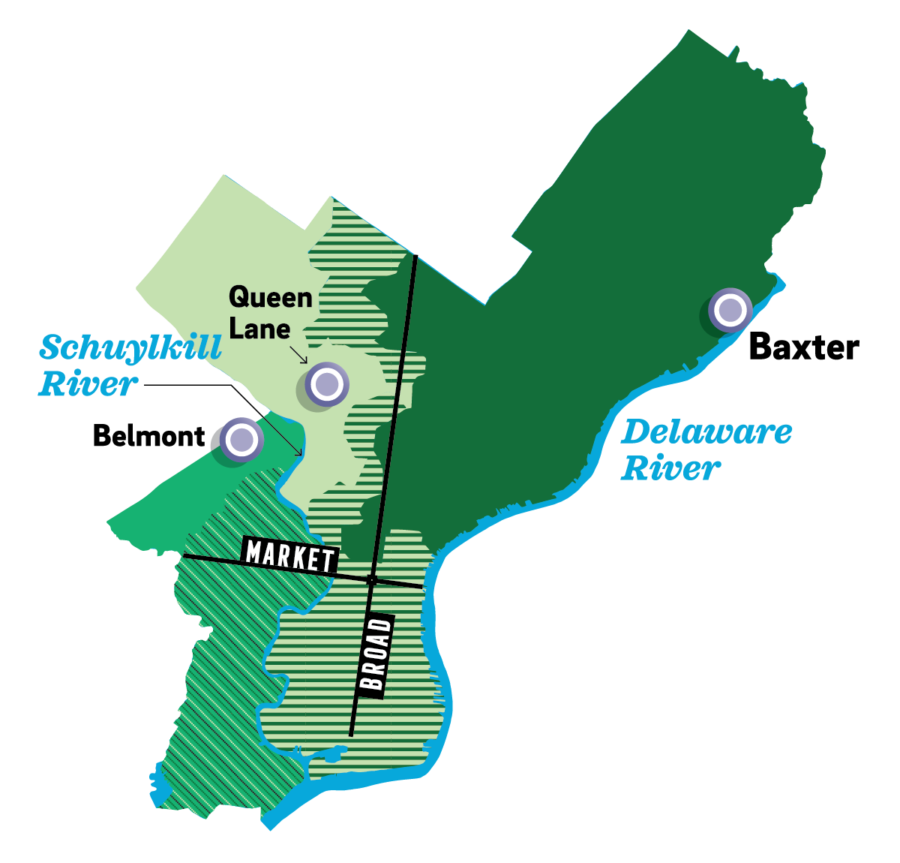
Note: This map reflects typical day‑to‑day operations.
Areas receiving a mix may be altered in emergency situations.
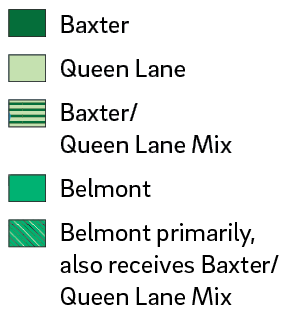
We have three drinking water treatment plants.
Baxter pulls water from the Delaware River. Queen Lane and Belmont pull from the Shuylkill. Each plant has a service area. Some areas in Philadelphia can receive a mix from multiple treatment plants.
Use the map above or enter your address to see where your water is treated:
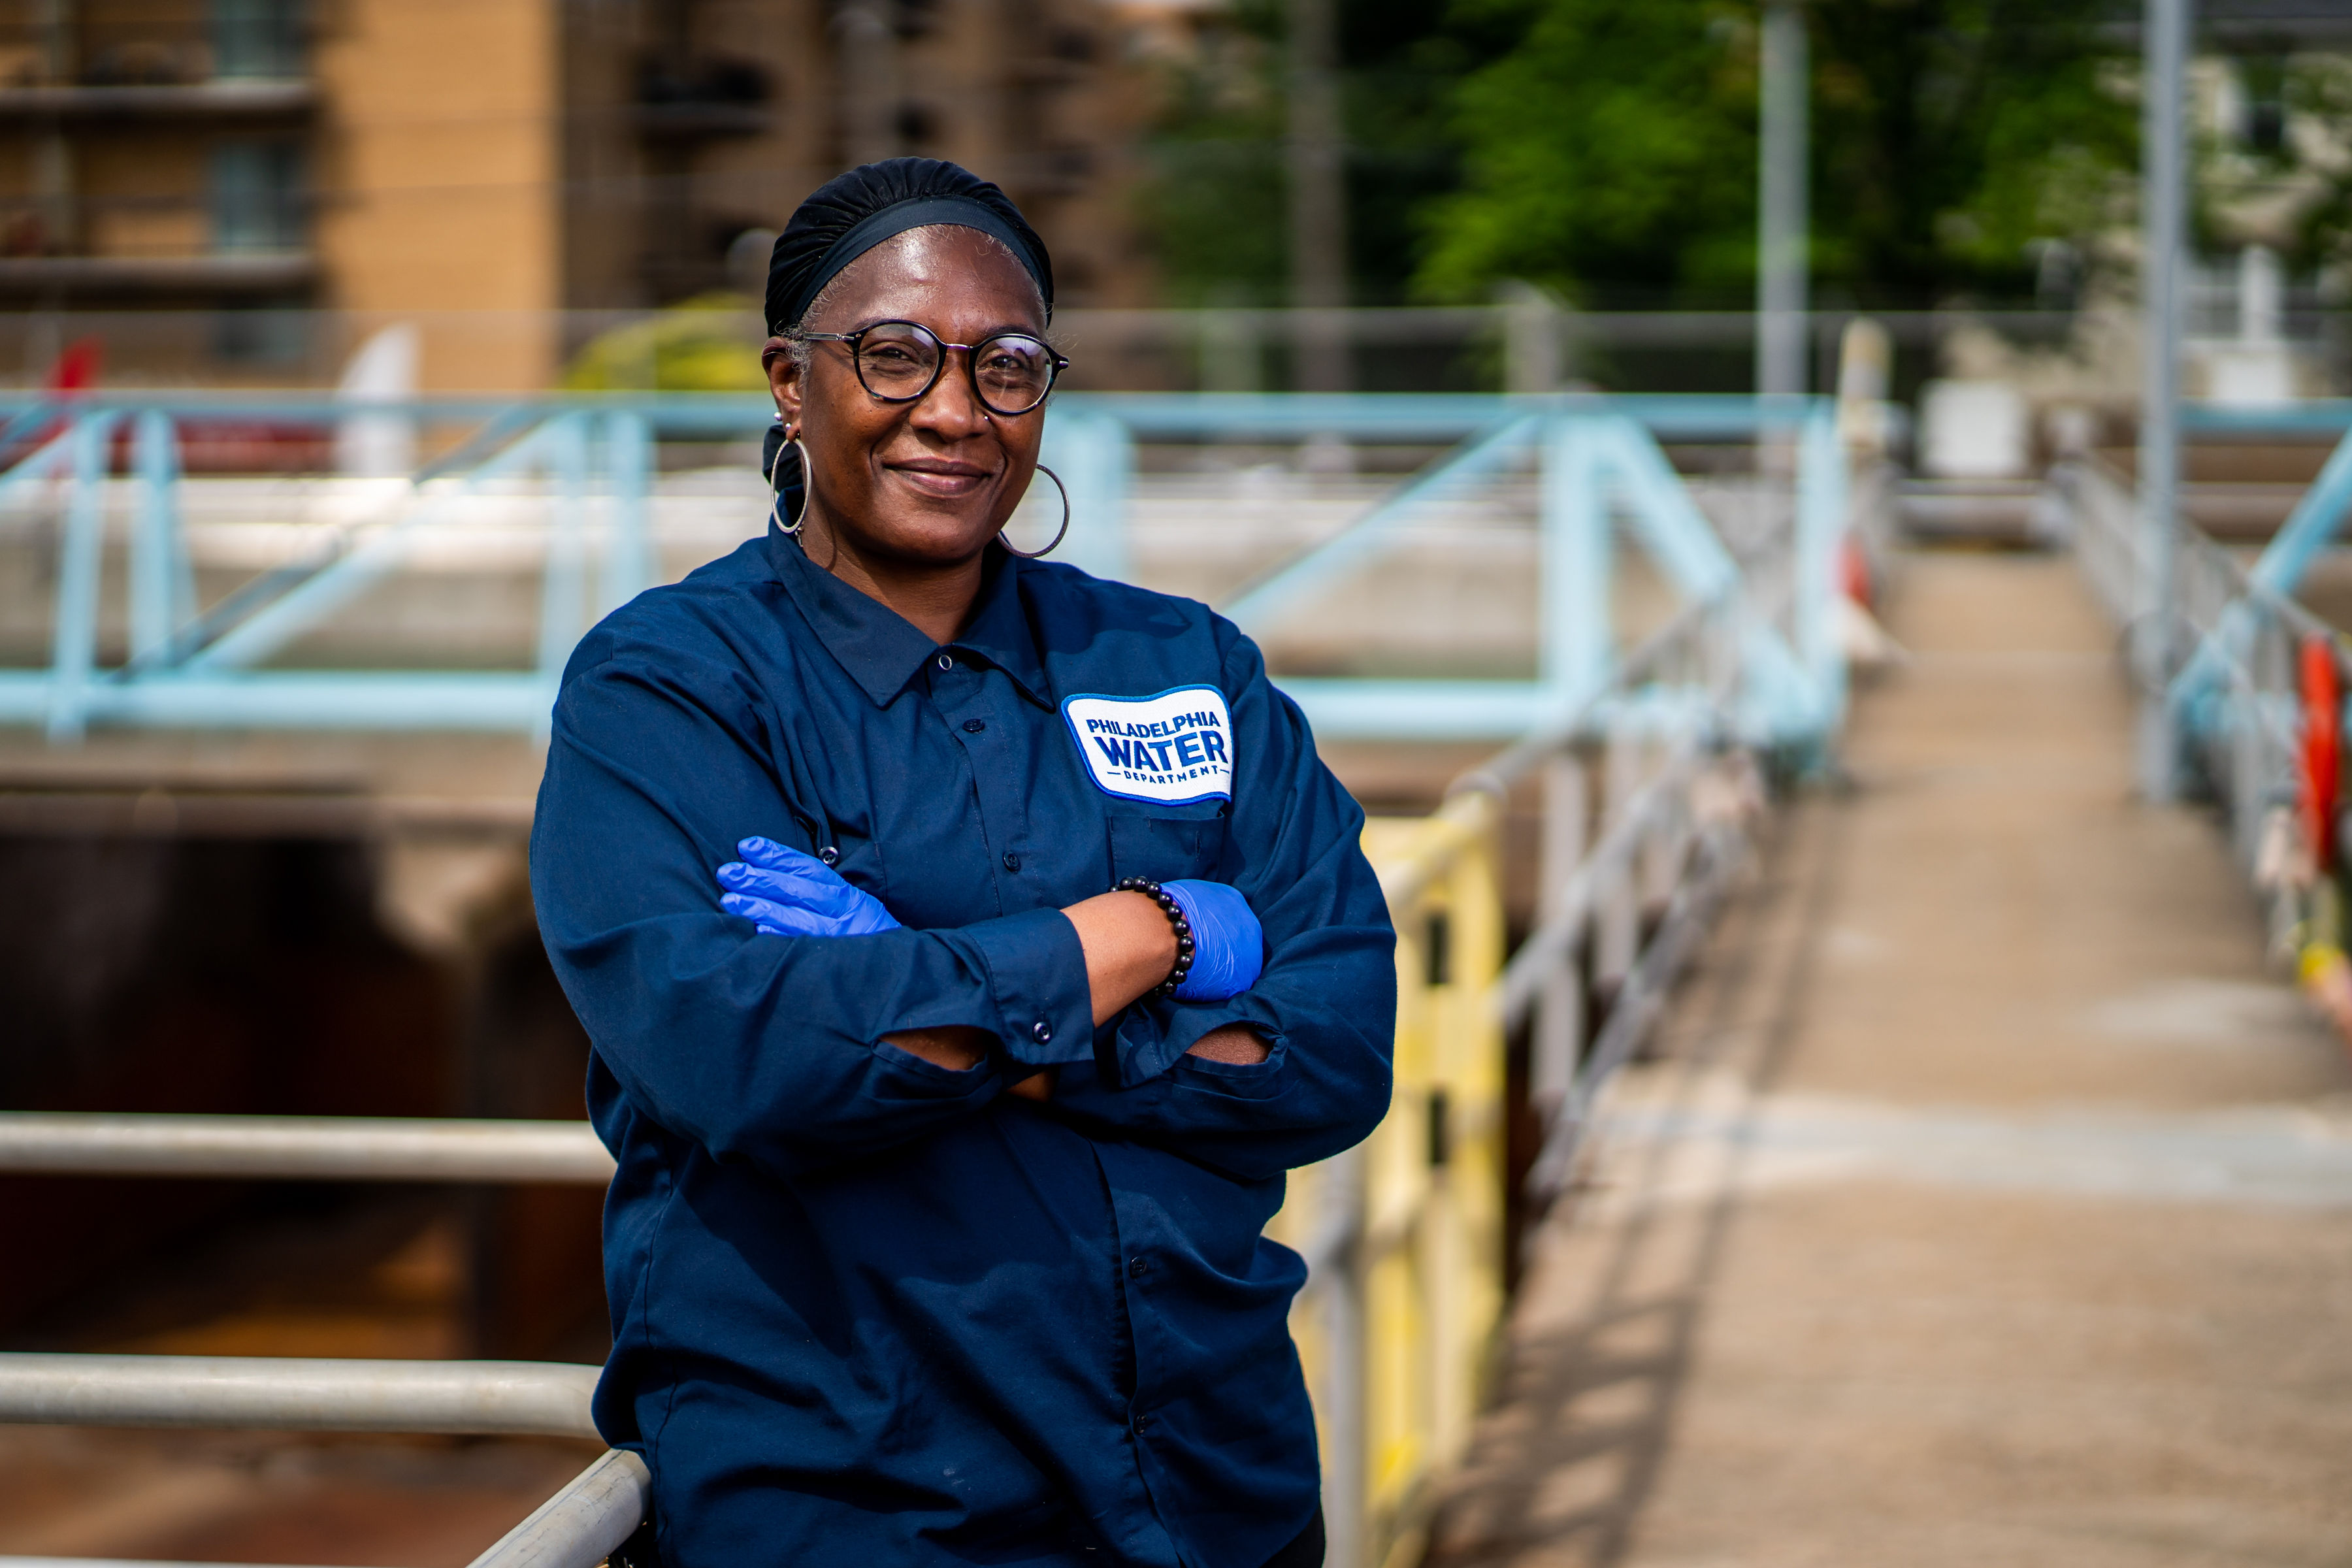
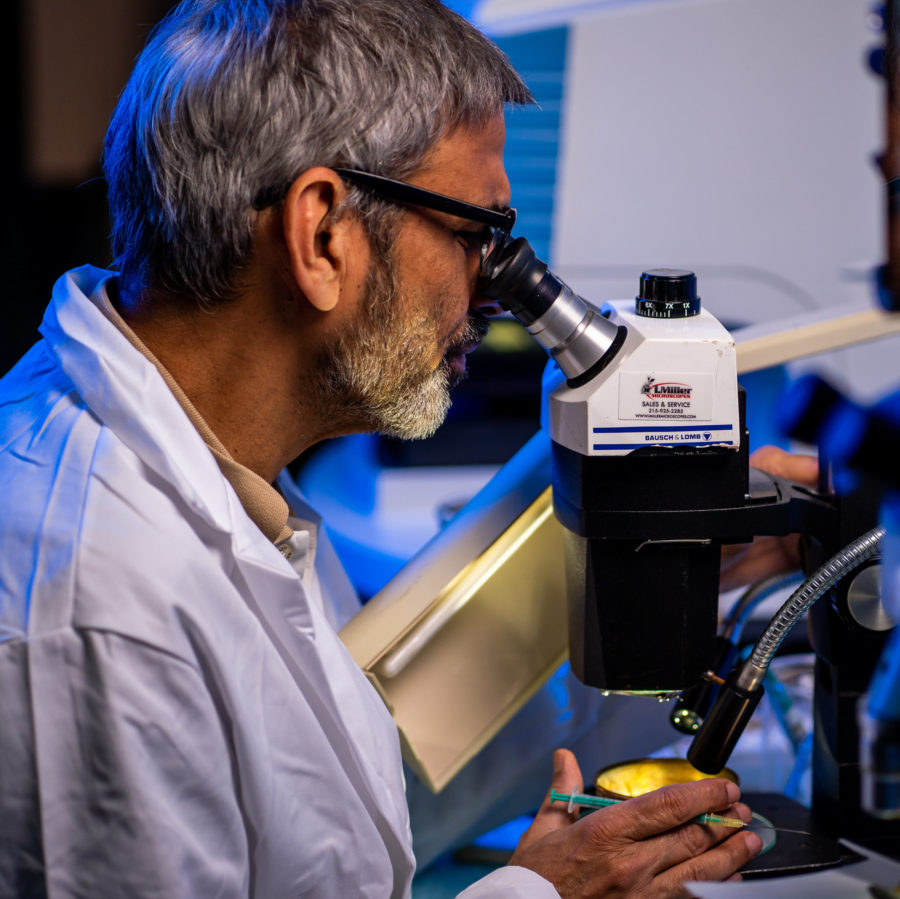
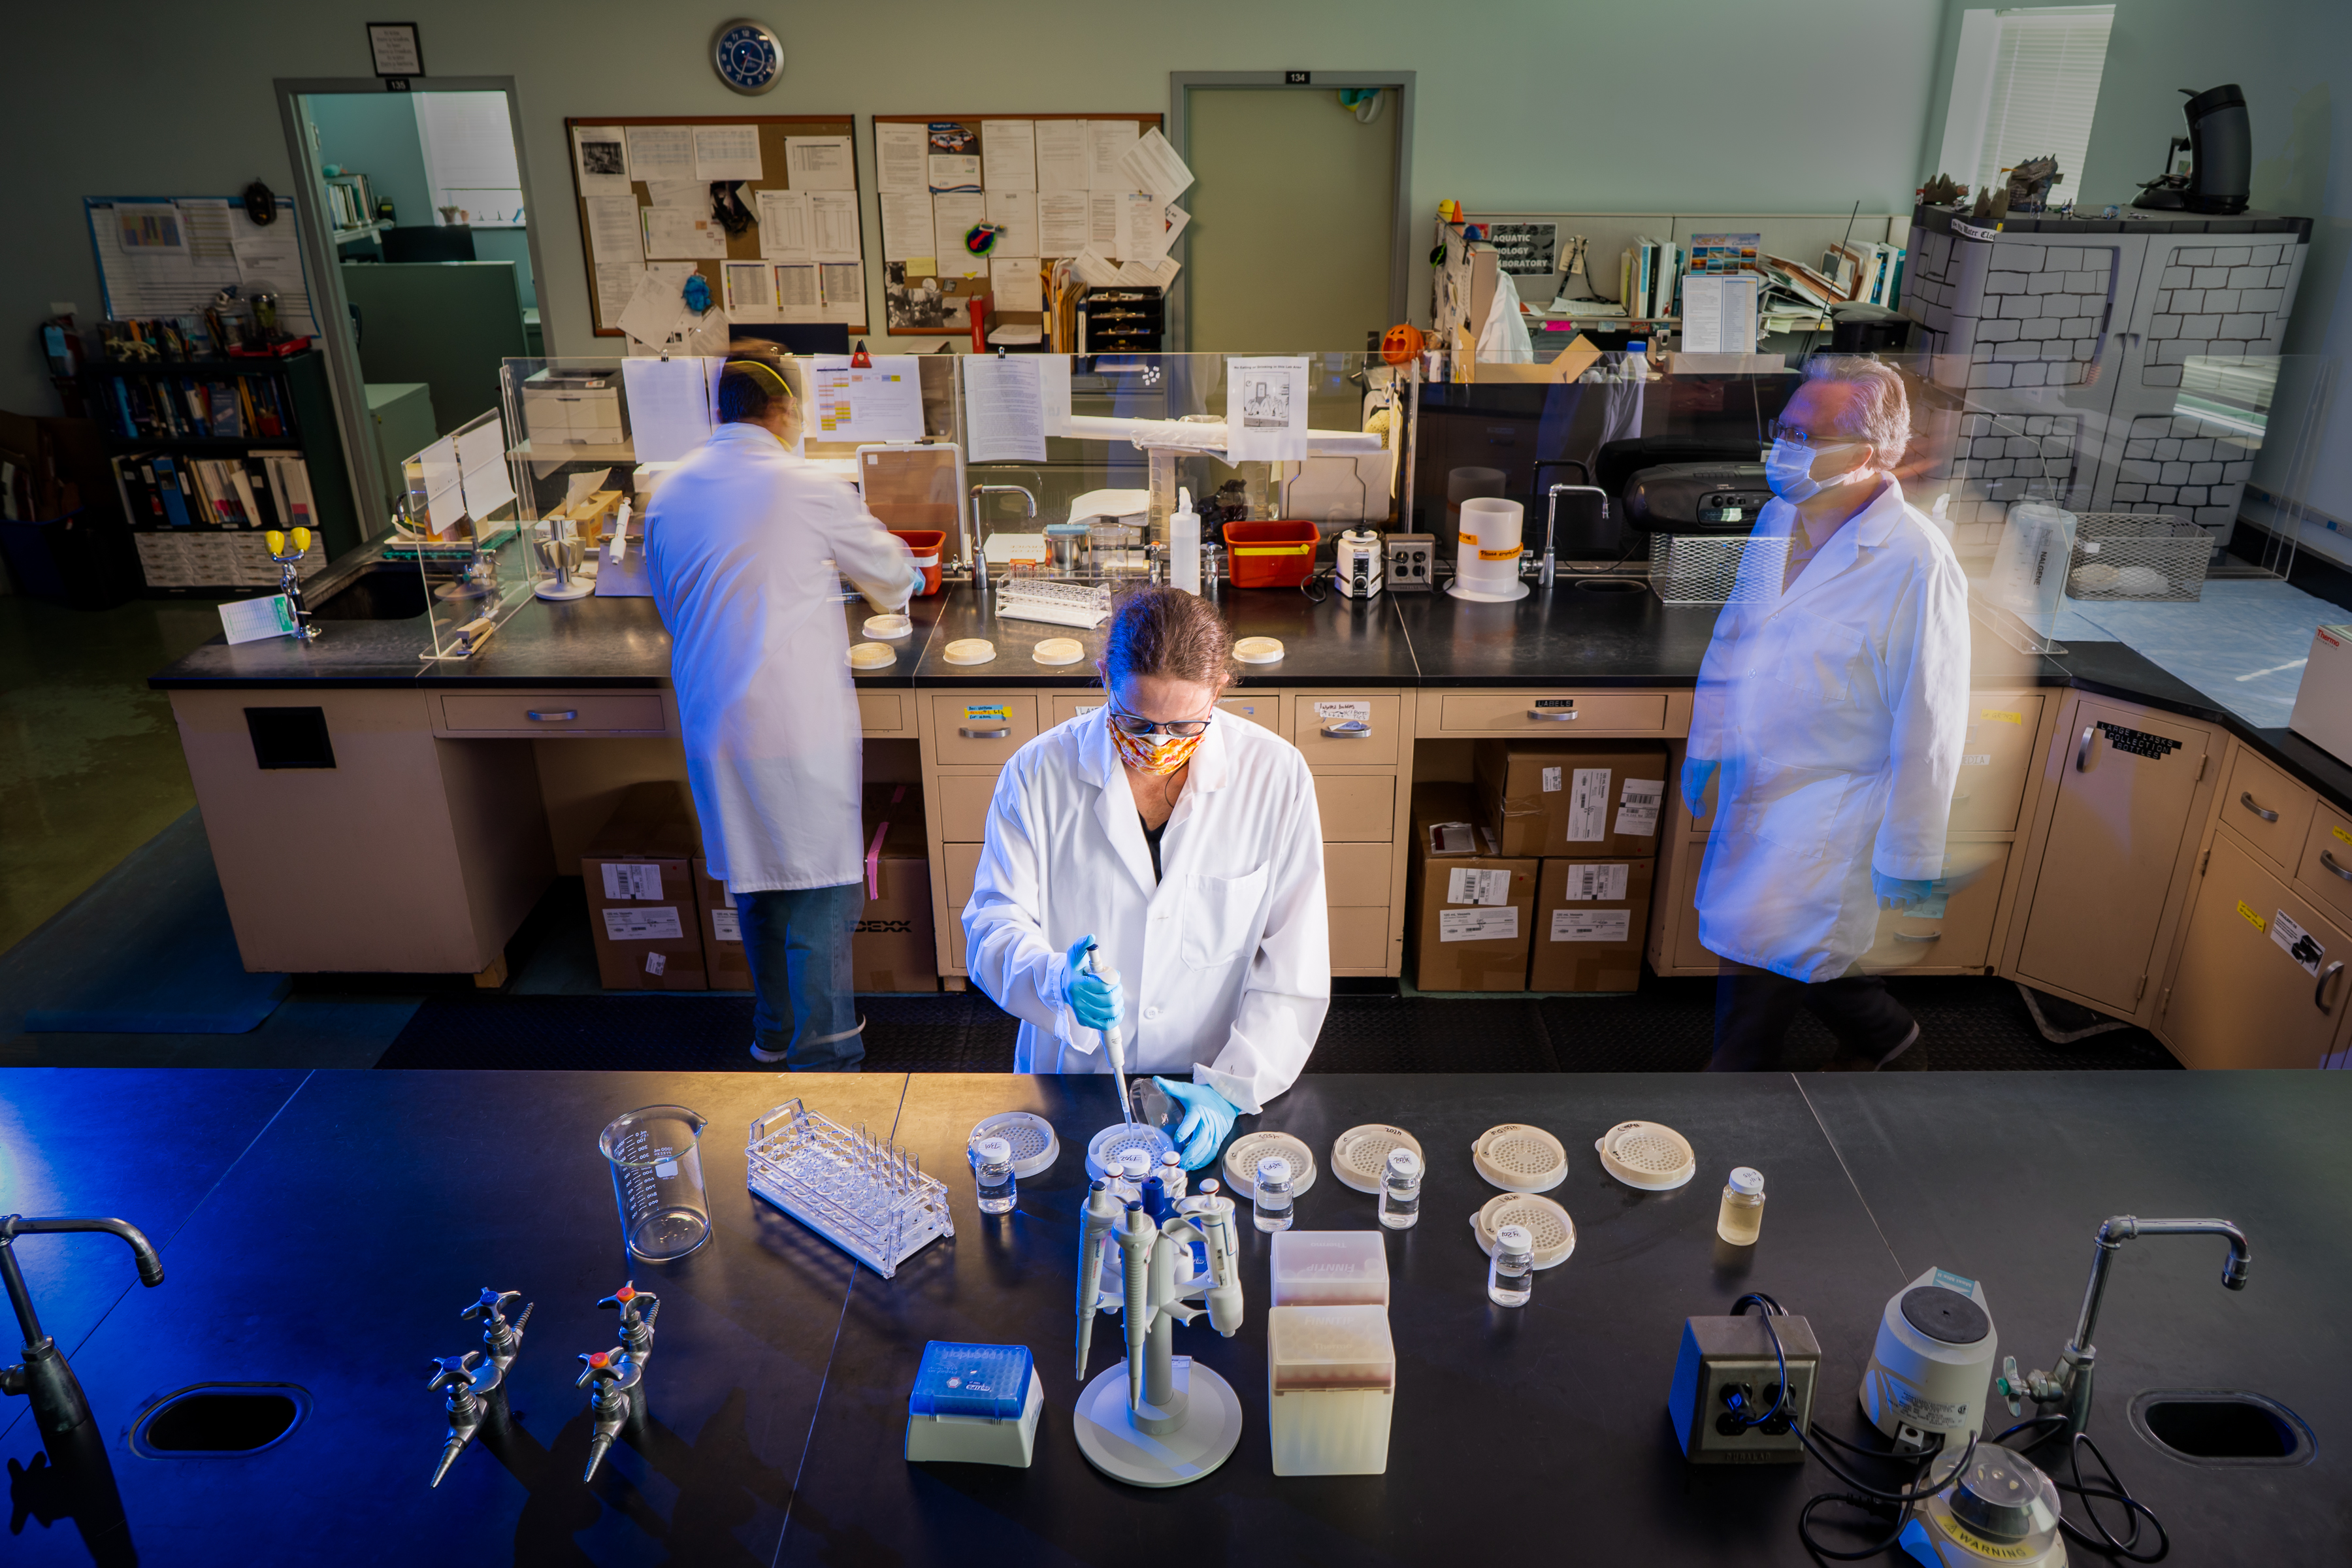
High‑quality staff. High‑quality results:
The experts working at our treatment plants take pride in using water drawn from our local rivers. Hundreds of millions of gallons of top‑quality drinking water are produced every day.
Typical Treatment Processes
These are some of the stages water goes through during normal operating conditions.
How long does it take? Our typical process can take days to complete.
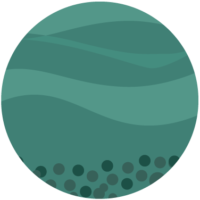
Gravity settling
River water is pumped to reservoirs. The heaviest sediment settles.
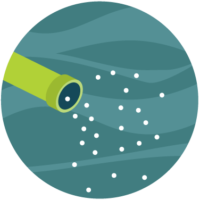
Disinfection
We add Sodium Hypochlorite to kill harmful organisms.
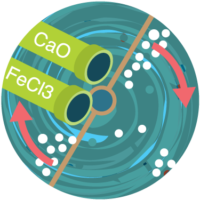
Coagulant, flocculation, and pH
Gentle mixing helps particles clump together. We also adjust the acidity.
Additional settling
Clumps of particles settle and are removed.
Additional disinfection
We add Sodium Hypochlorite a second time to kill any remaining harmful organisms.
Filtration
Filters remove more microscopic particles.
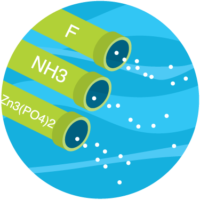
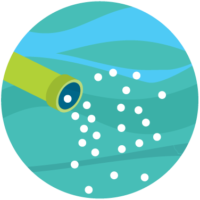
Additional treatment
Ingredients like Fluoride, Zinc Phosphate, and Ammonia help keep water healthy and safe.
Before water leaves the plant
We test our treated water for about 100 regulated contaminants, ranging from organisms like bacteria to chemicals like nitrate.
In 2022, we found no violations under state and federal regulations.
Final touches
Chlorine + Ammonia
Chlorine protects us from organisms found in untreated water that can cause disease. Ammonia is added to make the chlorine last longer and reduce the bleach-like smell.
Fluoride
All water contains some fluoride. We adjust the natural levels slightly to help protect your teeth against decay.
Zinc orthophosphate
Zinc orthophosphate is a compound that helps form a protective coating on pipes. It prevents corrosion (or breaking down over time).
A Closer Look
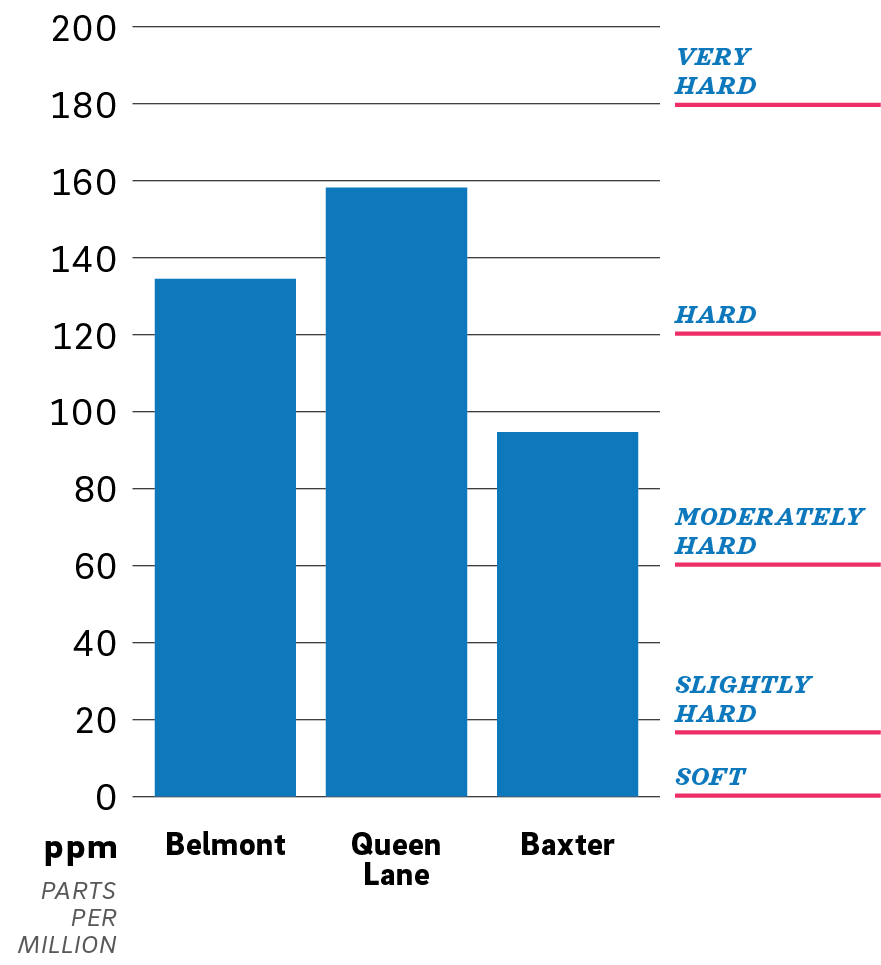
Hardness
The hardness of water is determined by the minerals naturally dissolved in it.
Hardness can vary based on natural conditions – for example, a drought can impact hardness.
Hardness matters if you use your water for activities like brewing beer or keeping a home aquarium. Customers often ask about hardness when researching appliances like dishwashers.
Most recent results
What this means for you
Hardness matters if you use your water for activities like brewing beer or keeping a home aquarium.
Most customers don’t need to monitor their water’s hardness.
☑ Result:
Philadelphia’s water is moderately hard or hard, depending on which treatment plant serves your neighborhood.
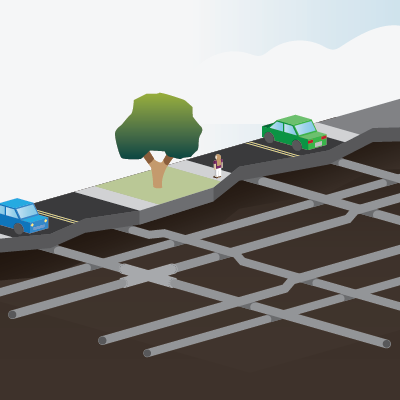
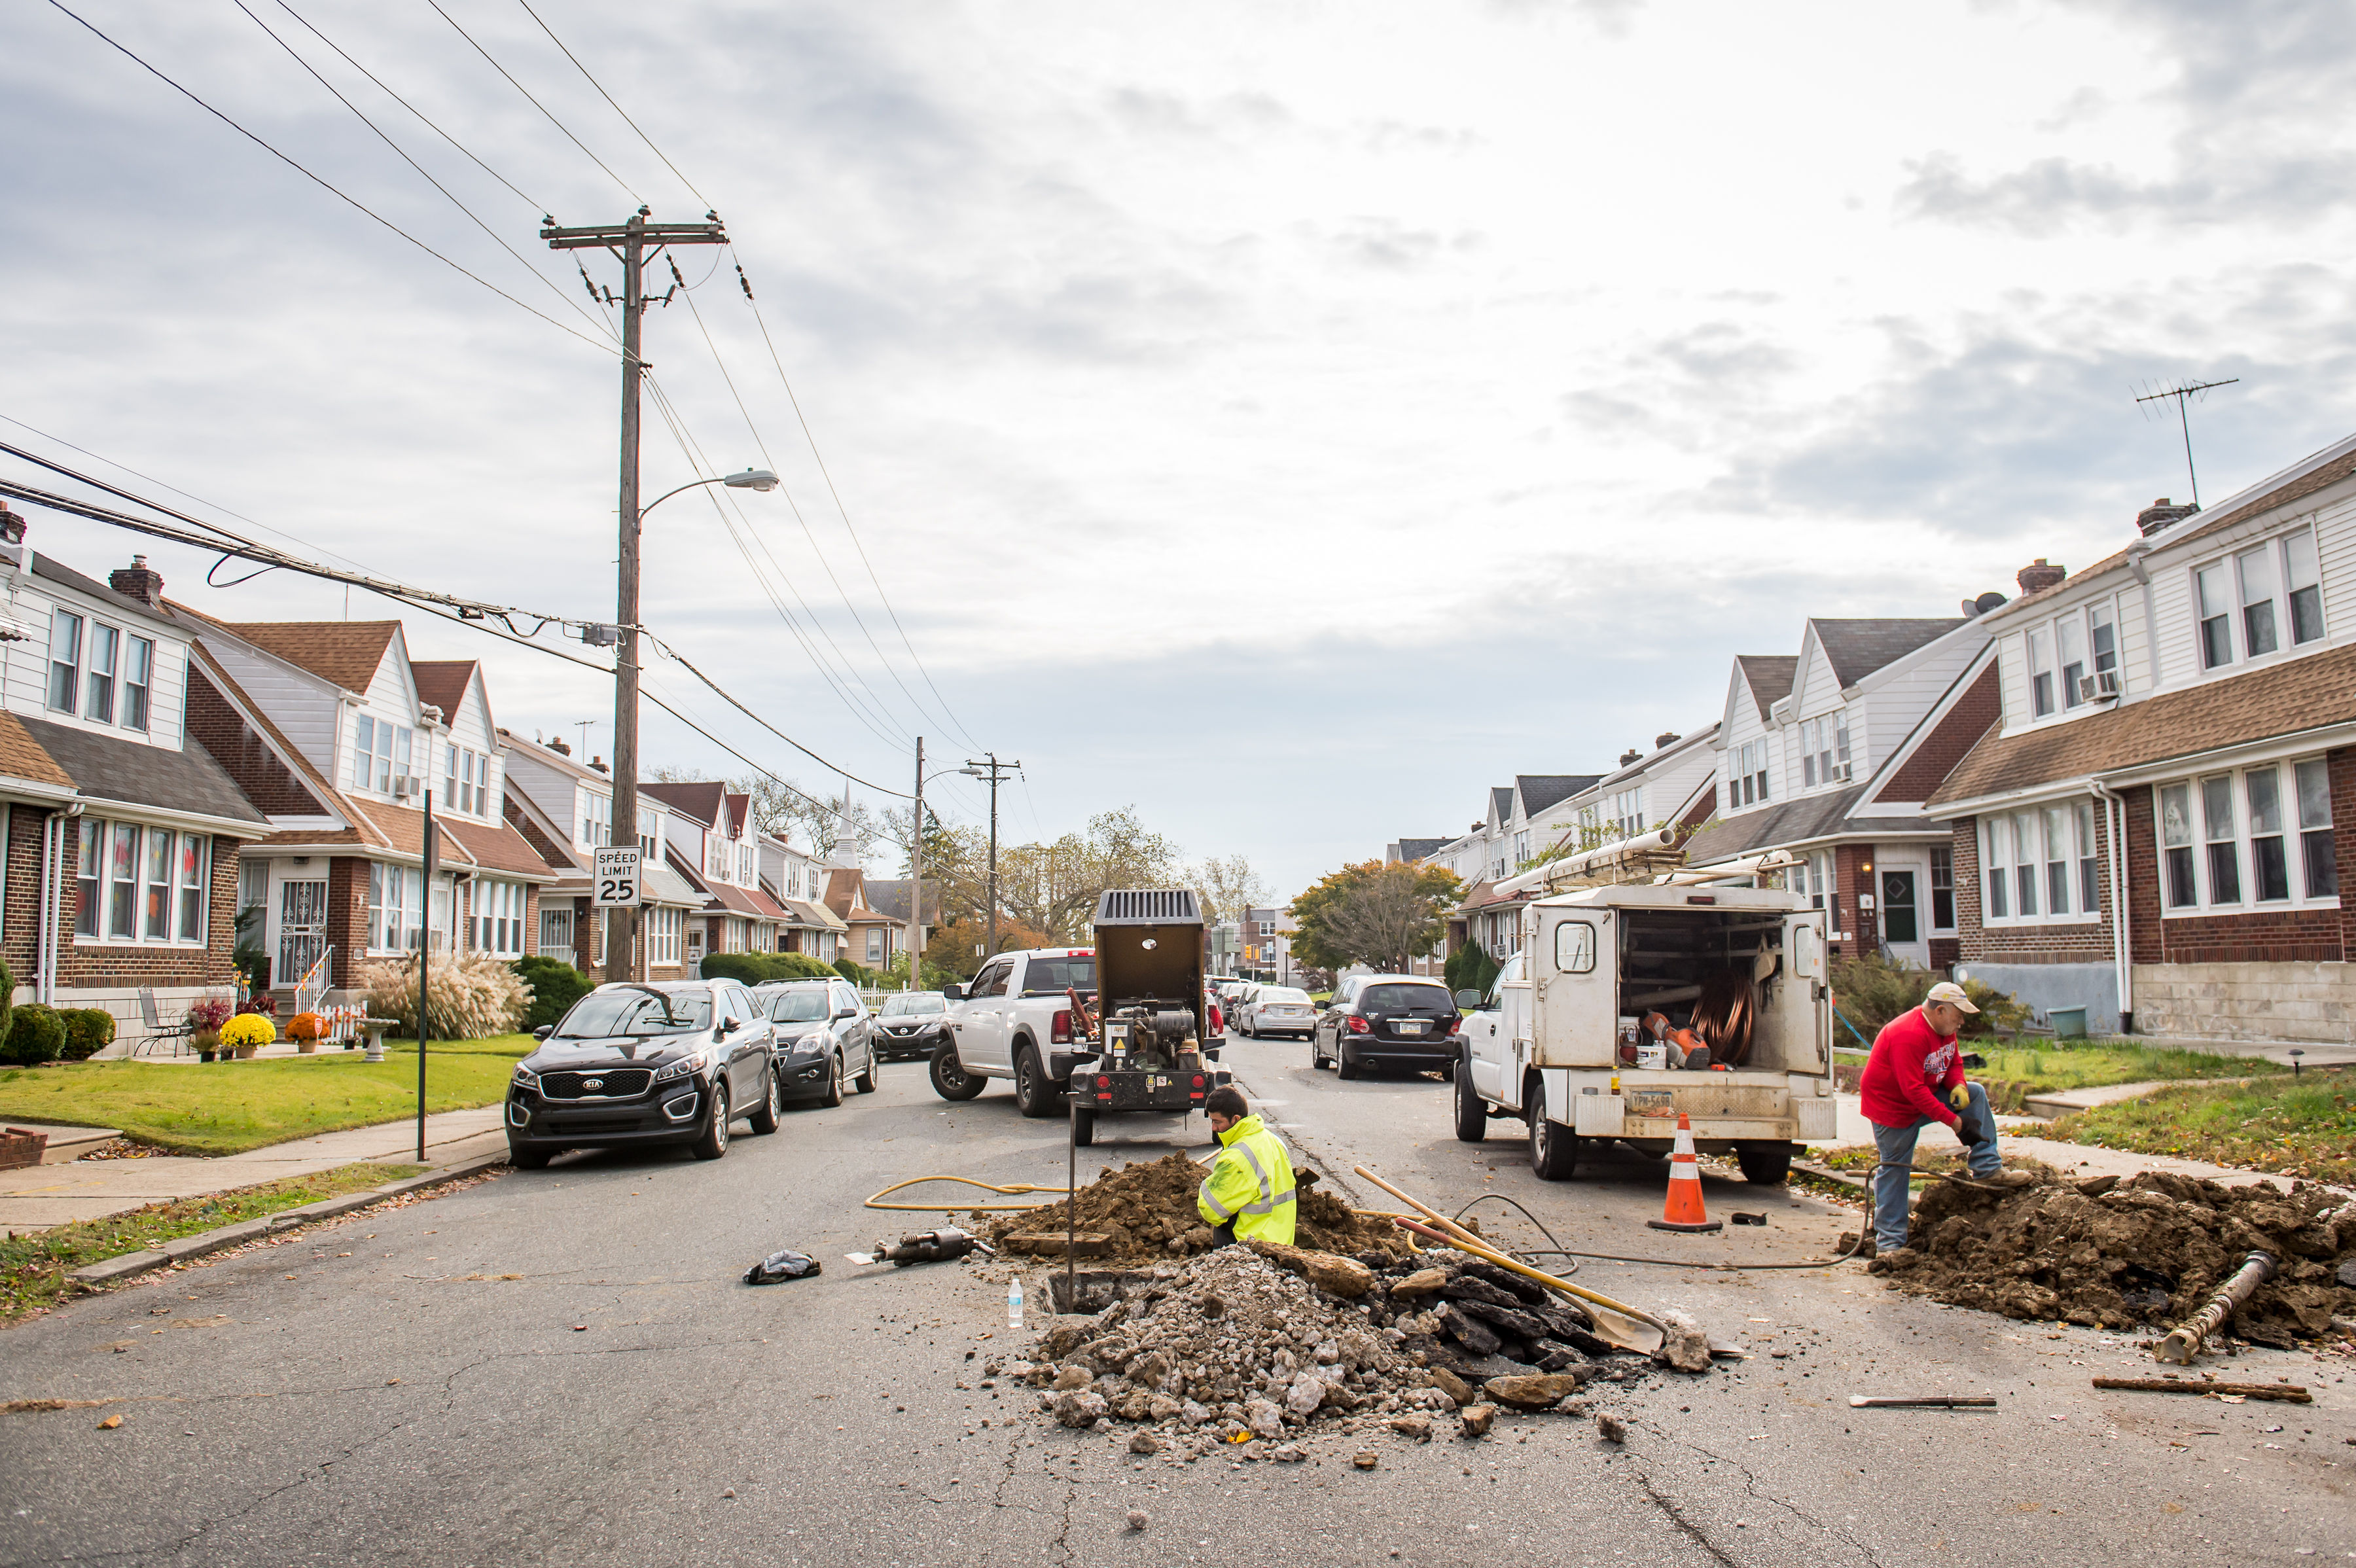
Part Two Delivery
Large scale water mains help transport water from treatment plants to customers.
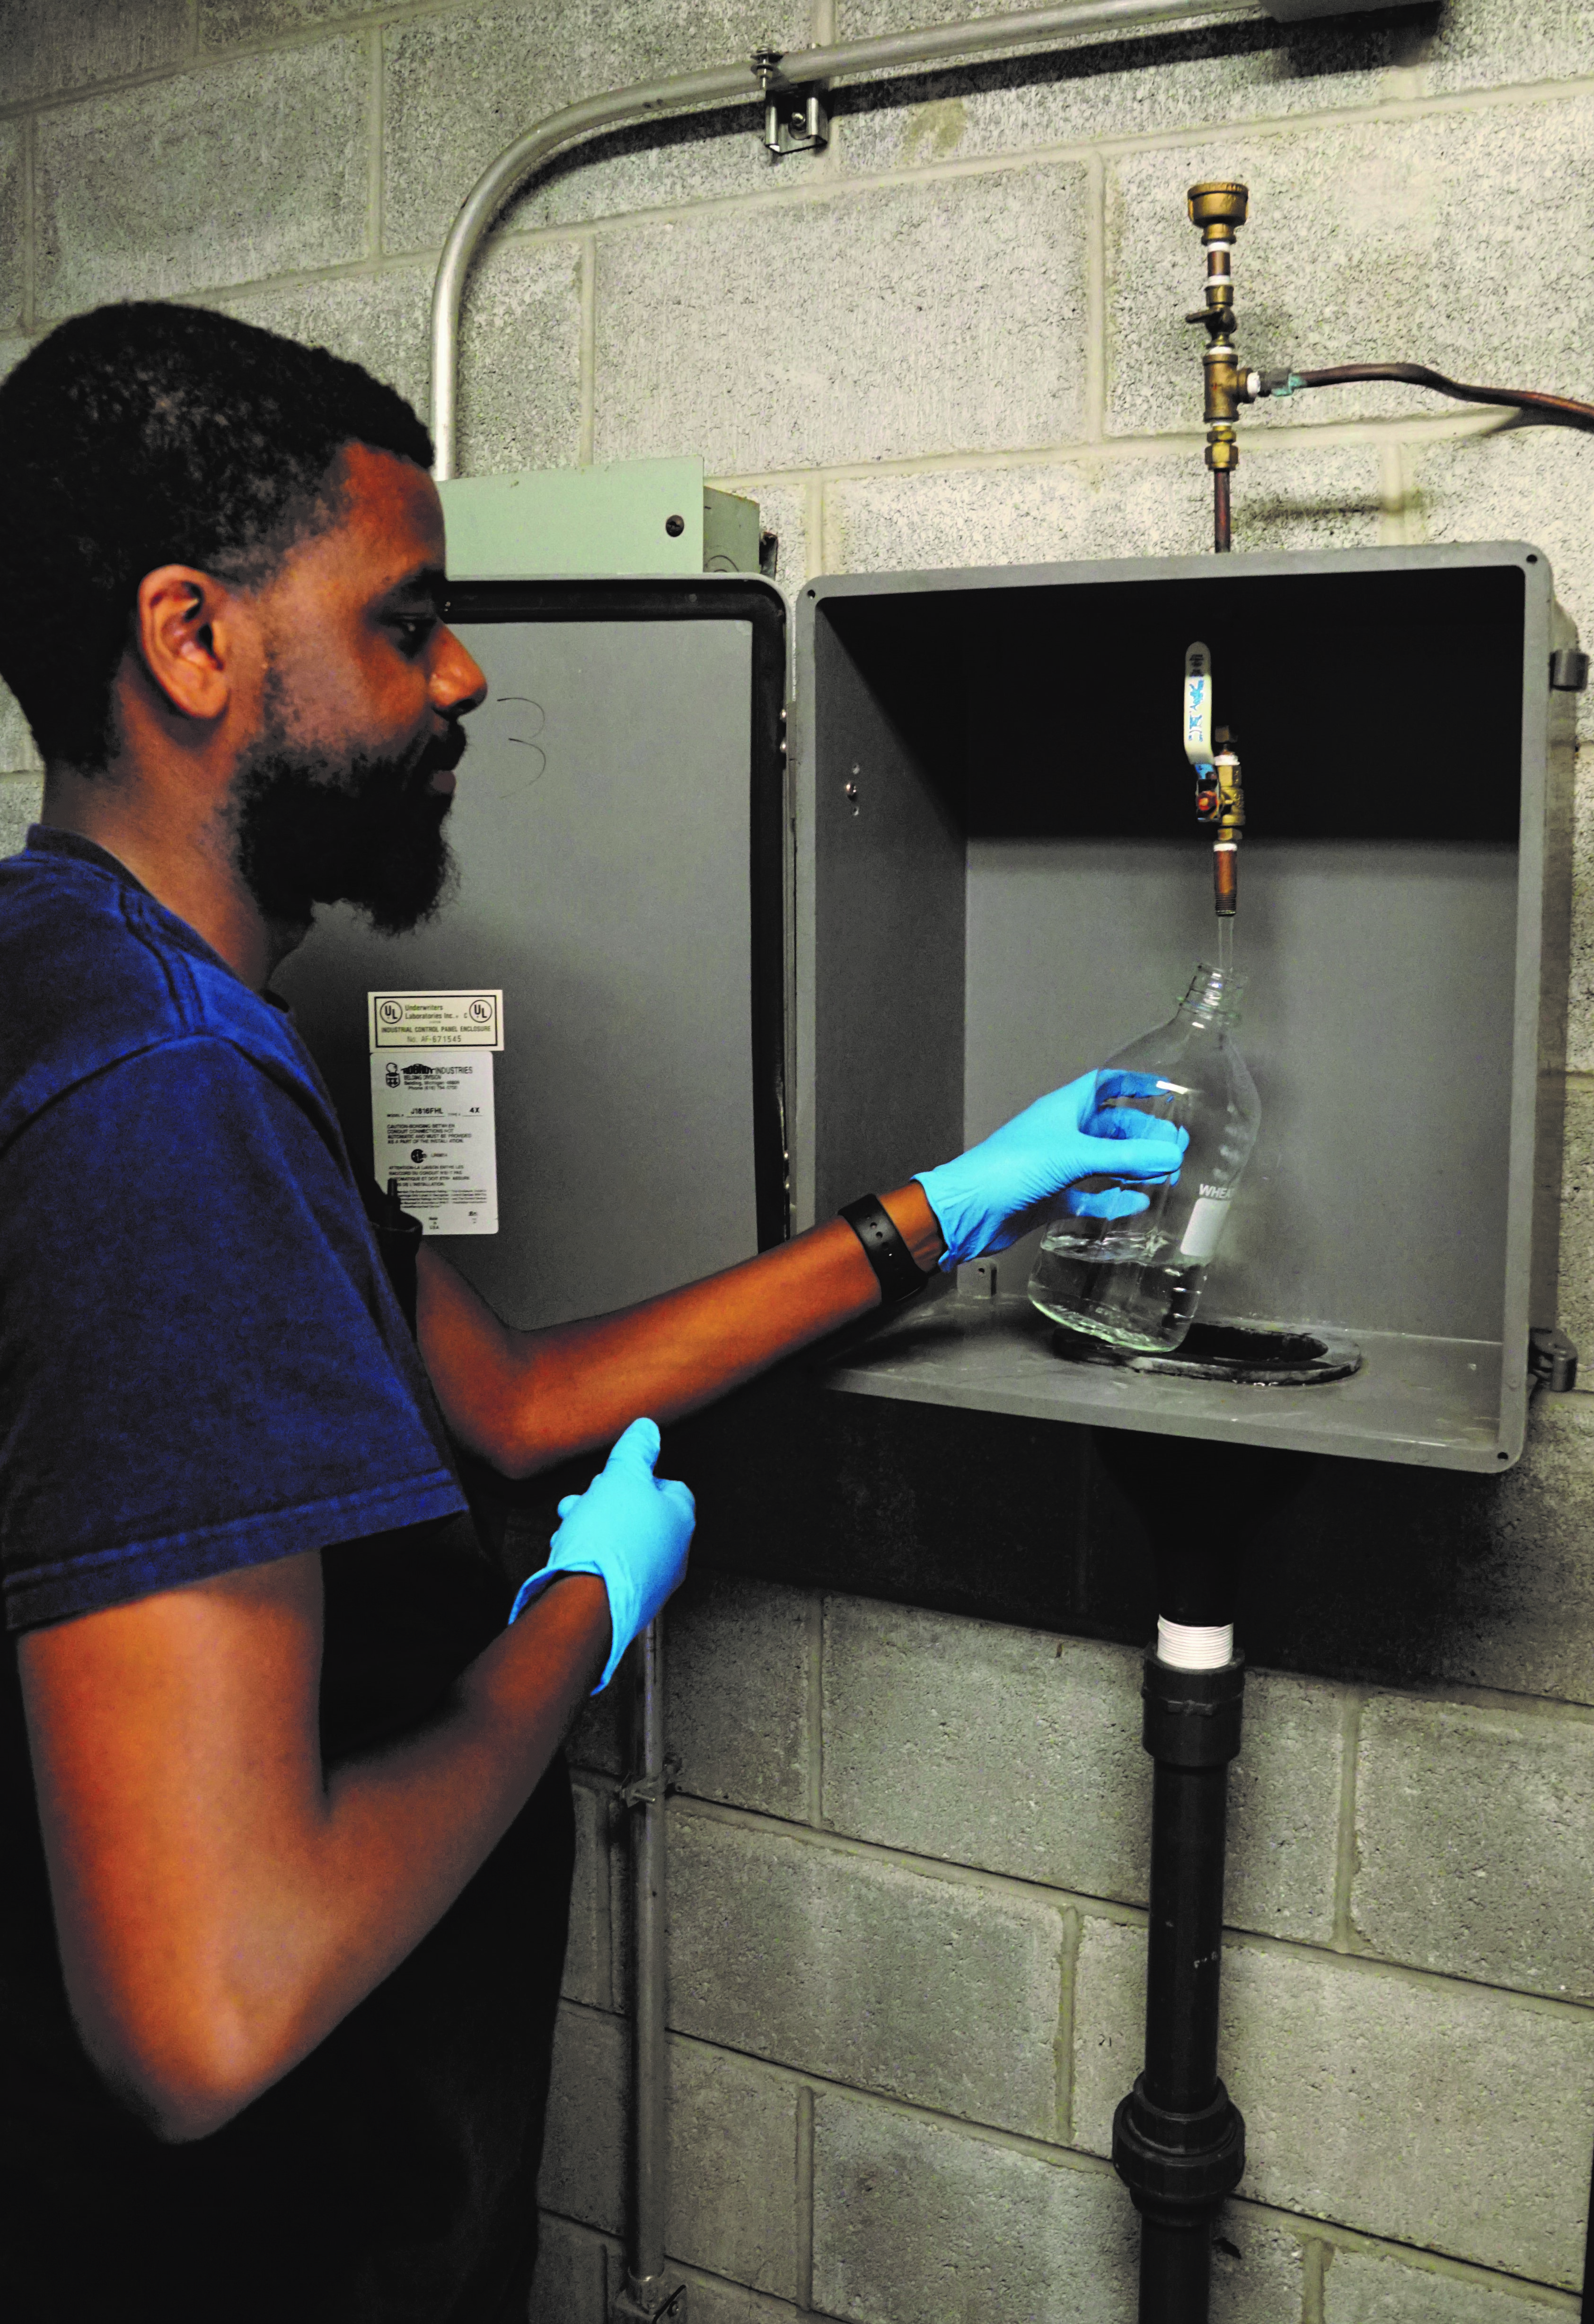
A safe path through the system
We have about 3,100 miles of water mains that deliver clean tap to customers. To ensure water stays safe as it moves from the plant to you, we take samples and monitor real-time water quality data, 24/7.
A Closer Look
Residual Chlorine
This test is done throughout the system. It checks that the chlorine added at plants remains at levels that keep water fresh and safe while staying within regulations.
Most recent results
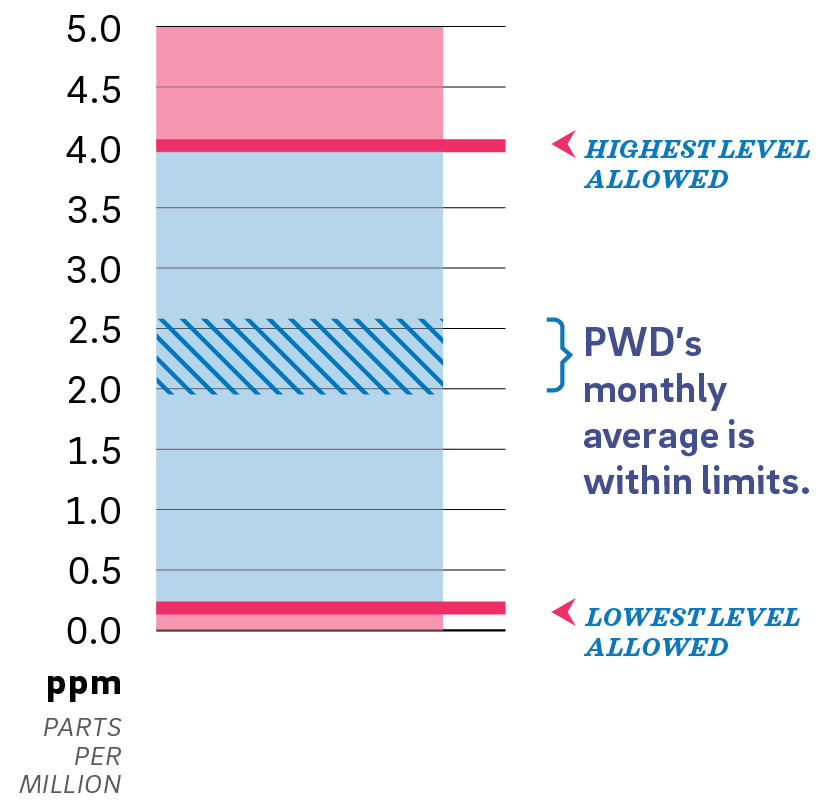
What this means for you
We travel the city to collect samples of drinking water from fire and police stations, pumping stations and more.
We do over 400 of these tests every month!
☑ Result:
Better than standards.
Spotlight:
Water
Revitalization
Plan
Philadelphia has a 25-year plan to upgrade and strengthen essential drinking water infrastructure.
We need a system that can respond to events like natural disasters or emergencies. New transmission mains will allow water service for the entire City from either river, if needed, for an indefinite period of time.
Dozens of projects are carefully coordinated. The sequence maximizes benefits for Philadelphians and reduces service interruptions and impacts.
Working with communities is a key component of our plan. The plan’s Stakeholder Advisory Group has a diverse roster of community members. They serve two-year terms helping to share plan information and progress.
Learn more:
water.phila.gov/revitalization
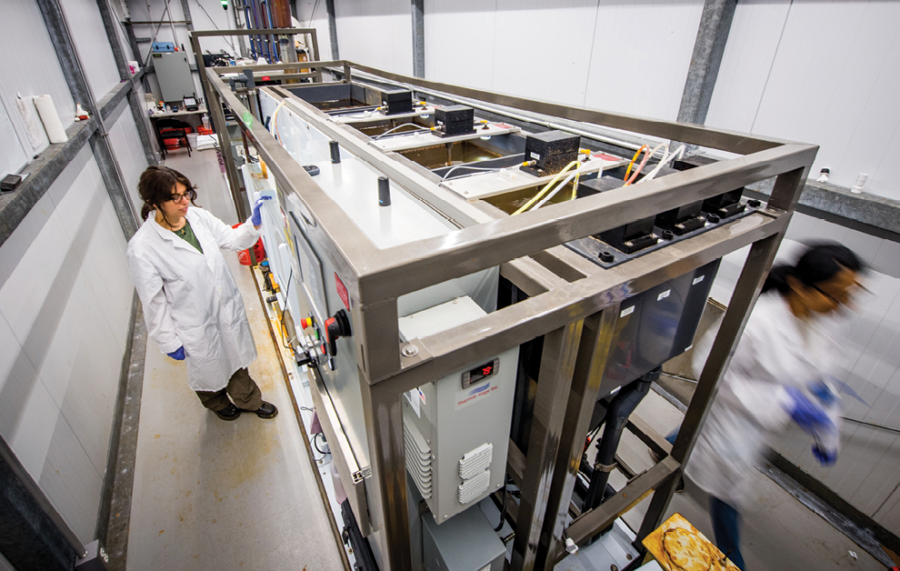
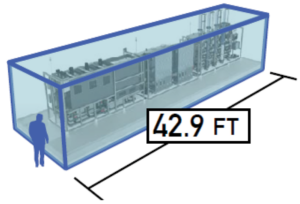
Plan Spotlight:
Mini Water Treatment Plants
Inside a container about the size of a trailer, PWD scientists test the methods planned for upgraded treatment plants. Mini laboratories like this allow us to test treatment methods before we use them at a much larger scale.
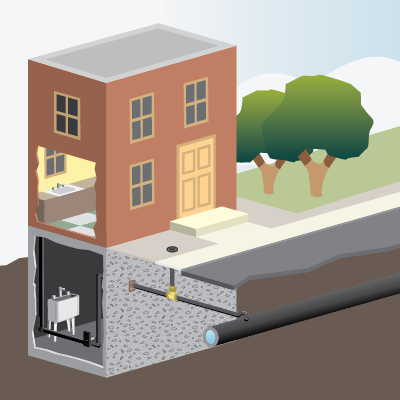
Part Three: At Home
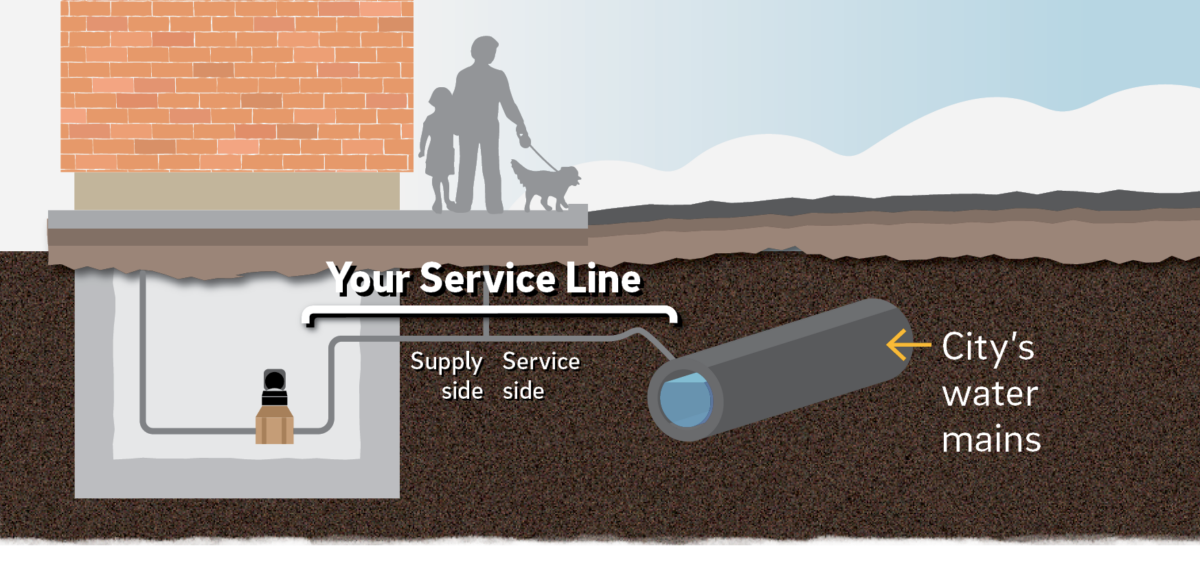
Every home on your block relies on a service line to carry water from the main to the property.
Meet your service line
You and your property’s plumbing play a role in keeping water safe.
The service line is a pipe that carries clean water from the city’s water mains into your home. It’s a part of your property’s plumbing, even though it’s usually underground.
If you own your property, the service line is your responsibility.
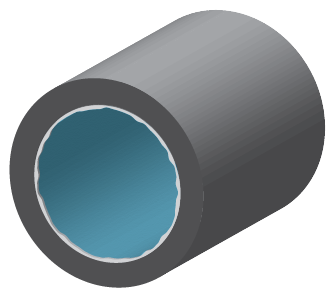
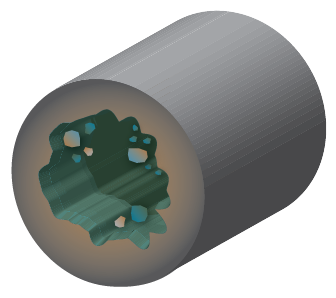
Corrosion Control
Reducing risks from lead in a property’s plumbing
We treat water to prevent lead pipes from corroding. This is called corrosion control, and it prevents lead from dissolving into water. Tests at homes with lead plumbing show our treatment is working: corrosion control keeps lead levels below state and federal limits.
What do we mean by “flushing your pipes”?
Flushing pushes the water that is sitting in pipes out and down your drain until fresh water comes through the tap. When pipes are disturbed during construction or repairs, they might require flushing.
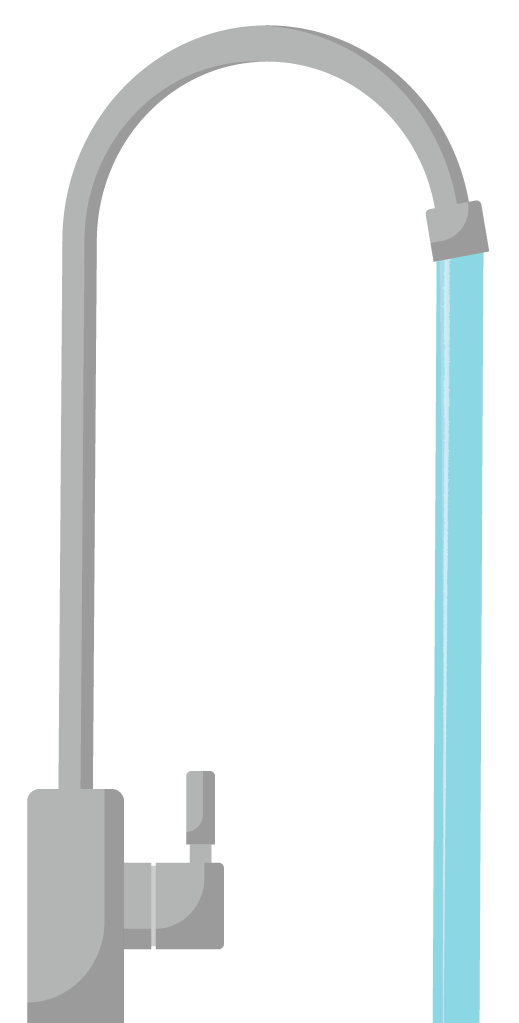
Fresh water starts at
our water mains.
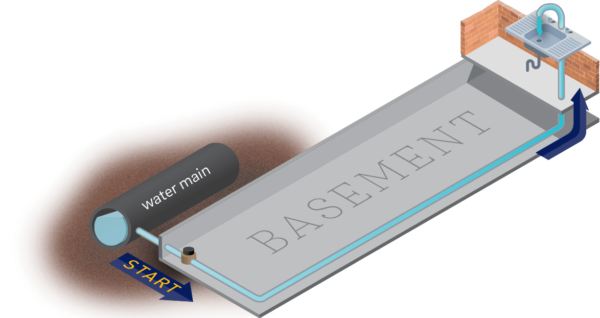
Running the tap gets rid of water sitting in pipes.
Healthy home habit
If you haven’t used water for 6 hours or more: Run your cold water for 3-5 minutes. This will flush out water that’s been sitting in your pipes.
It only costs a penny or two to ensure top-quality tap!
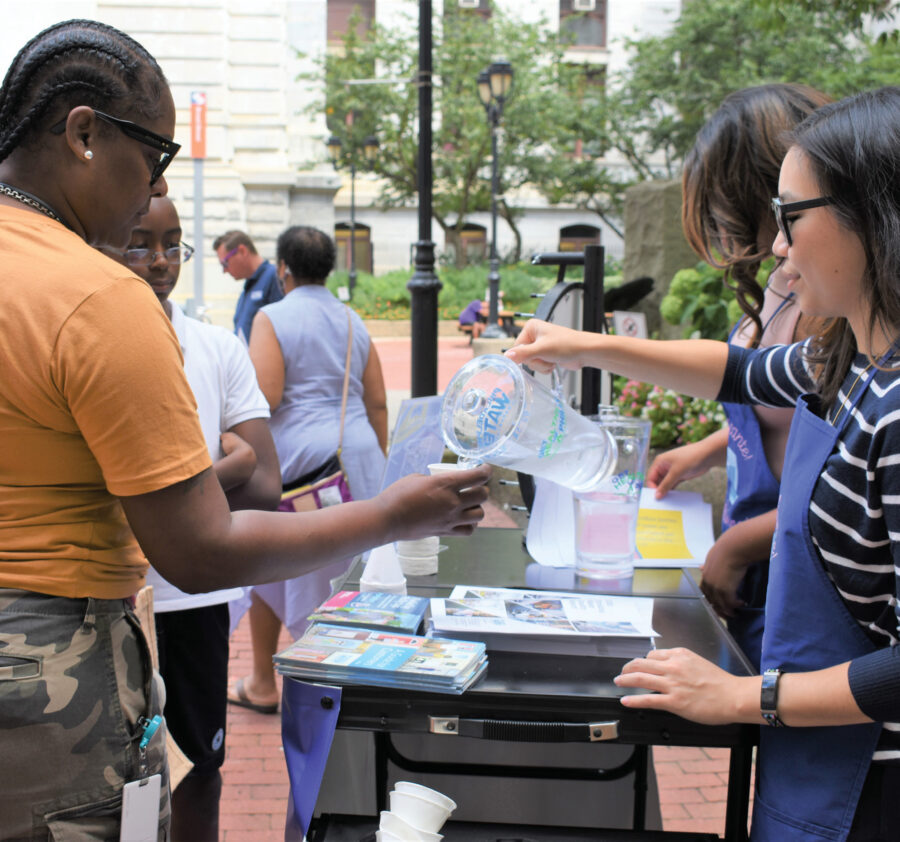
Talking about tap water
In neighborhoods across Philadelphia, our customers tell us what matters to them. When it comes to tap water, there’s a lot to talk about!
For starters, some residents are surprised they can get great drinking water right at home for less than a penny per gallon.
In conversations, we hear loud and clear: Safe drinking water is a top priority, and people are excited to learn more about water quality.
If lead is detected in drinking water, it comes from a property’s plumbing
A home’s older fixtures & valves:
It could be in fixtures, valves, and solder.
Lead was prohibited from plumbing materials in 1986.
Service Line:
This pipe connects a property’s plumbing to the water main in the street.
Homes from 1950 or earlier may still have lead in sections of the service line.
A Closer Look
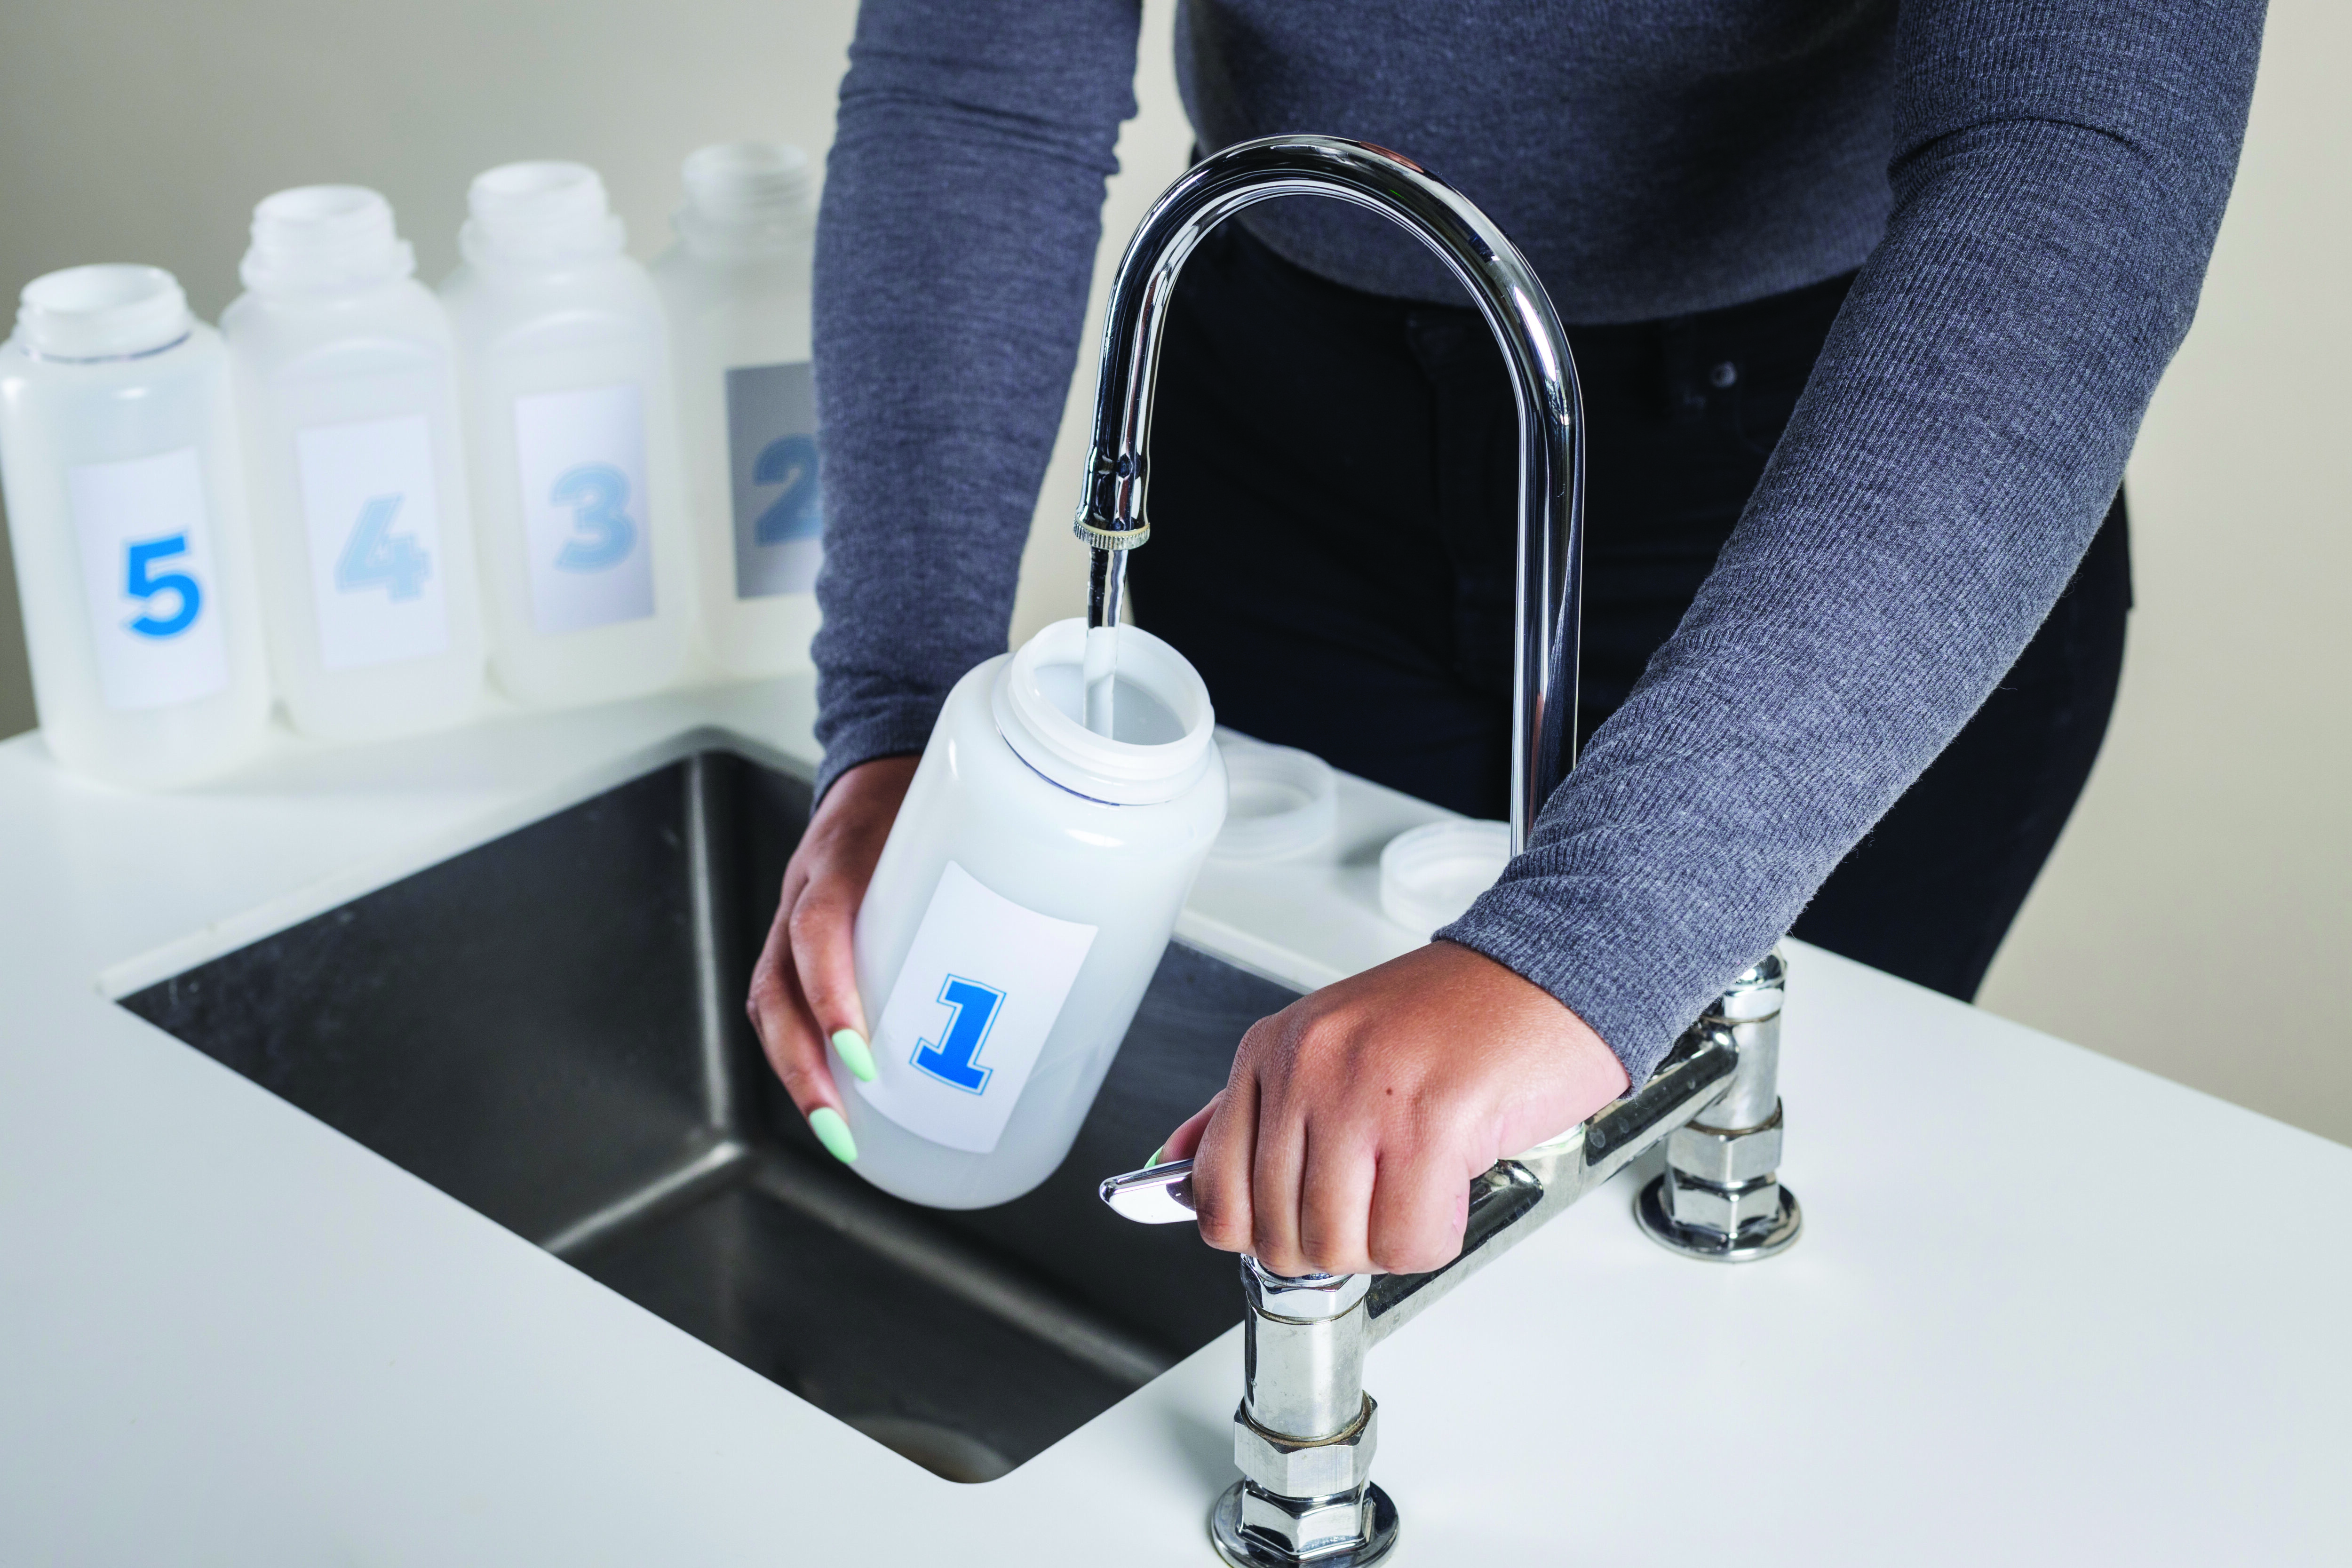
Carefully monitoring Lead
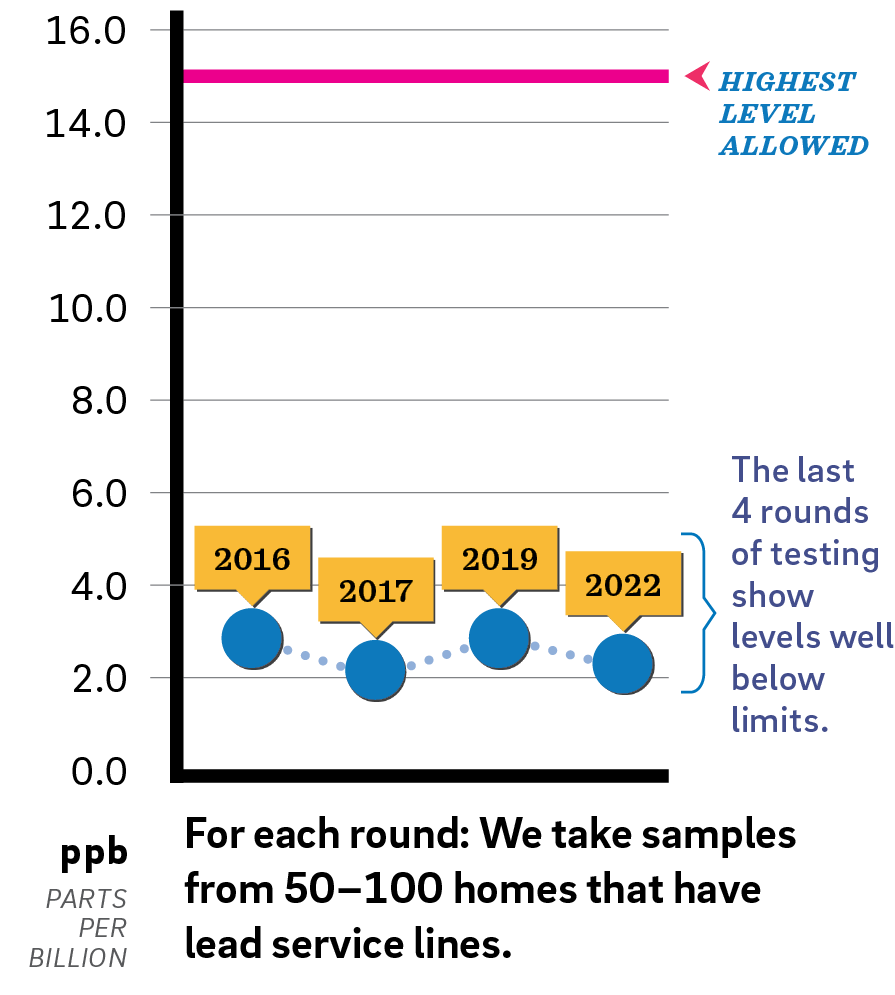
In addition to regular tests in customer homes, every three years we complete a rigorous round of sampling for lead and copper. We take samples from homes that have lead service lines.
We share the results with the EPA and the public.
The EPA requires that 90% of homes show lead levels less than 15 ppb.
Recent results
What this means for you
The EPA is updating their guidelines for sampling. This will impact future results. We support this effort to make sure the sampling is accurate, and to help identify homes with lead plumbing.
☑ Result:
Lead levels are consistently lower than limits set by the EPA.
US EPA Guidance
The EPA requires public water providers like the Philadelphia Water Department to monitor drinking water for lead at customer taps. If lead levels are higher than 15 parts per billion (ppb) in more than 10% of taps sampled, water providers must inform customers and take steps to reduce lead in water.
If present, elevated levels of lead can cause serious health problems, especially for pregnant women and young children. Lead in drinking water is primarily from material and components associated with service lines and home plumbing.
The Philadelphia Water Department is responsible for providing safe drinking water but cannot control the variety of materials used in plumbing components. If you haven’t turned on your tap for several hours, you can minimize the potential for lead exposure by flushing your tap before using water for drinking and cooking. If you are concerned about lead in your water, you may wish to have your water tested. Information on lead in drinking water, testing methods, and steps you can take to minimize exposure is available from the Safe Drinking Water Hotline (800) 426-4791 or at: www.epa.gov/safewater/lead.

We offer a zero-interest loan for replacing lead service lines.
The Homeowners Emergency Loan Program (HELP) can cover the cost of a replacement.
Learn more & apply: www.phila.gov/water/helploan
2022 Data tables & More
All of PWD’s results are better than the required and recommended federal levels designed to protect public health.
This data shows how our process keeps your drinking water safe.
By reporting these results in these tables, we are meeting a requirement of the EPA.
Some contaminants may pose a health risk at certain levels to people with special health concerns. Others are used as indicators for treatment plant performance.
What’s a “PPM”?
Many of these results are reported as “parts per million (ppm)” or “parts per billion (ppb)”.
Here’s what that looks like:
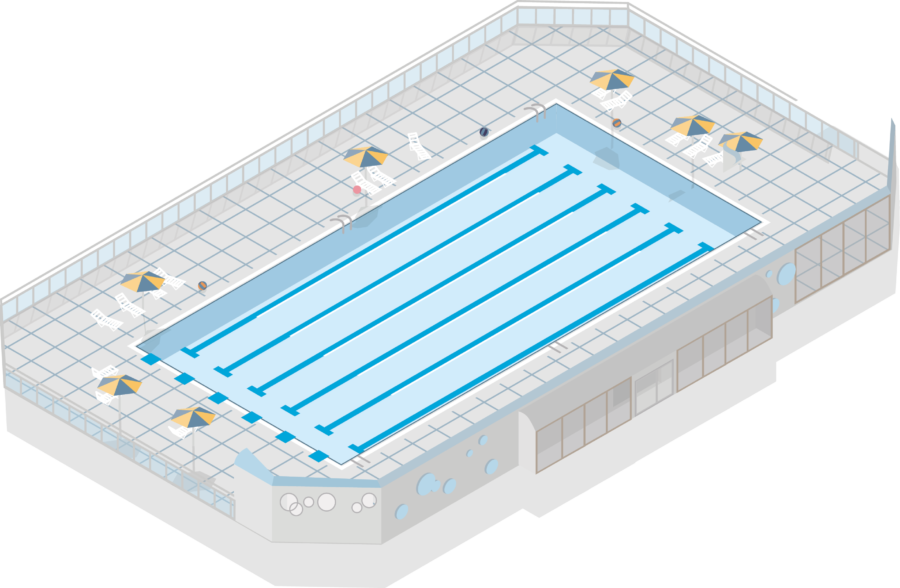
ppm (parts per million):
Denotes 1 part per 1,000,000 parts, which is equivalent to two thirds of a gallon in an Olympic-sized swimming pool.
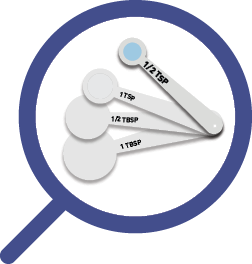
ppb (parts per billion):
Denotes 1 part per 1,000,000,000 parts, which is equivalent to half a teaspoon in an Olympic-sized swimming pool.
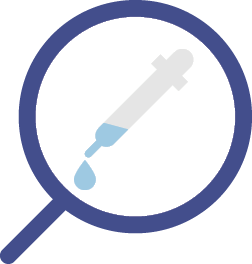
ppt (parts per trillion):
Denotes 1 part per 1,000,000,000,000 parts, which is equivalent to one drop in 20 Olympic-sized swimming pools.
For more abbreviations and their definitions, visit the Glossary.
Illustration: GoodStudio / Shutterstock.com, and Philadelphia Water Department
What we test for and how
Public drinking water systems monitor their treated drinking water for approximately 100 regulated contaminants. These regulatory parameters are defined within federal rules such as the Revised Total Coliform Rule, Surface Water Treatment Rule, Disinfectants and Disinfection Byproducts Rules, Lead and Copper Rule, and the Radionuclides Rule.
We monitor for the regulated parameters listed below.
Any contaminants found are noted in the tables on the following pages:
Inorganic Chemicals
Antimony
Arsenic
Barium
Beryllium
Cadmium
Chromium
Copper
Cyanide
Fluoride
Lead
Mercury
Nickel
Nitrate
Nitrite
Selenium
Thallium
Synthetic Organic Chemicals
2,3,7,8 – TCDD (Dioxin)
2,4 – D, 2,4,5 – TP (Silvex)
Alachlor
Atrazine
Benzopyrene
Carbofuran
Chlordane
Dalapon
Di(ethylhexyl)adipate
Di(ethylhexyl)phthalate
Dibromochloropropane
Dinoseb
Diquat
Endothall
Endrin
Ethylene Dibromide
Glyphosate
Heptachlor
Heptachlor epoxide
Hexachlorobenzene
Hexachlorocyclopentadiene
Lindane
Methoxychlor
Oxamyl
PCBs Total
Pentachlorophenol
Picloram
Simazine
Toxaphene
Volatile Organic Chemicals
Benzene
Carbon Tetrachloride
1,2-Dichloroethane
o-Dichlorobenzene
p-Dichlorobenzene
1,1-Dichloroethylene
cis-1,2-Dichloroethylene
trans-1,2-Dichloroethylene
Dichloromethane
1,2-Dichloropropane
Ethylbenzene
Monochlorobenzene
Styrene
Tetrachloroethylene
Toluene
1,2,4-Trichlorobenzene
1,11-Trichloroethane
1,1,2-Trichloroethane
Trichloroethylene
o-Xylene
m,p-Xylenes
Vinyl Chloride
Other factors that can impact drinking water
Appealing to Your Senses

We work to ensure your water looks, tastes and smells the way it should.
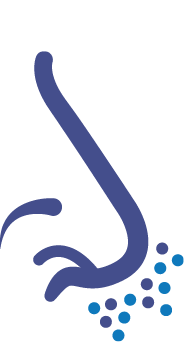
To meet all water quality taste and odor guidelines, we test for the following: alkalinity, aluminum, chloride, color, hardness, iron, manganese, odor, pH, silver, sodium, sulfate, surfactants, total dissolved solids, turbidity, and zinc.
Temperature and Cloudiness
The temperature of the Schuylkill and Delaware Rivers varied seasonally in 2021 from approximately 34°–88° Fahrenheit. PWD does not treat the water for temperature.

Cloudiness in tap water most commonly happens in the winter, when the cold water from the water main is warmed up quickly in household plumbing. Cold water and water under pressure can hold more air than warmer water and water open to the atmosphere.
When really cold winter water comes out of your tap, it’s simultaneously warming up and being relieved of the pressure it was under inside the water main and in your plumbing. The milky white color is actually just tiny air bubbles. If you allow the glass to sit undisturbed for a few minutes, you will see it clear up gradually.
2022 Data tables
Lead & Copper– Tested at customers’ taps: Testing is done every 3 years. Most recent tests were done in 2022. | ||||||
|---|---|---|---|---|---|---|
| EPA’s Action Level – for a representative sampling of customer homes | Ideal Goal (EPA’s MCLG) | 90% of PWD customers’ homes were less than | Number of homes considered to have elevated levels | Violation | Source | |
| Lead | 90% of homes must test less than 15 ppb | 0 ppb | 2.0 ppb | 3 out of 104 | No | Corrosion of household plumbing; Erosion of natural deposits |
| Copper | 90% of homes must test less than 1.3 ppm | 1.3 ppm | 0.219 ppm | 0 out of 104 | No | Corrosion of household plumbing; Erosion of natural deposits; Leaching from wood preservatives |
Inorganic Chemicals (IOC)– PWD monitors for IOC more often than required by EPA. | ||||||
|---|---|---|---|---|---|---|
| Chemical | Highest Level Allowed (EPA’s MCL) | Ideal Goal (EPA’s MCLG) | Highest result | Range of Test Results for the Year | Violation | Source |
| Antimony | 6 ppb | 6 ppb | 0.4 ppb | 0–0.4 ppb | No | Discharge from petroleum refineries; fire retardants; ceramics; electronics; solder |
| Barium | 2 ppm | 2 ppm | 0.052 ppm | 0.028–0.052 ppm | No | Discharges of drilling wastes; Discharge from metal refineries; Erosion of natural deposits |
| Chromium | 100 ppb | 100 ppb | 2 ppb | 0–2 ppb | No | Discharge from steel and pulp mills; Erosion of natural deposits |
| Fluoride | 2 ppm* | 2 ppm* | 0.81 ppm | 0.74–0.81 ppm | No | Erosion of natural deposits; Water additive which promotes strong teeth; Discharge from fertilizer and aluminum factories |
| Nitrate | 10 ppm | 10 ppm | 4.10 ppm | 0.85–4.10 ppm | No | Runoff from fertilizer use; Leaching from septic tanks; Erosion of natural deposits |
| ||||||
Total Chlorine Residual– Continuously monitored at Water Treatment Plants | |||||
|---|---|---|---|---|---|
| Sample Location | Minimum Disinfectant Residual Level Allowed | Lowest Level Detected | Yearly Range | Violation | Source |
| Baxter WTP | 0.2 ppm | 2.56 ppm | 2.56–3.49 ppm | No | Water additive used to control microbes |
| Belmont WTP | 1.83 ppm | 1.83–2.90 ppm | |||
| Queen Lane WTP | 1.60 ppm | 1.60–3.50 ppm | |||
Total Chlorine Residual– Tested throughout the Distribution System. Over 360 samples collected throughout the City every month. | |||||
|---|---|---|---|---|---|
| Sample Location | Maximum Disinfectant Residual Allowed | Highest Monthly Average | Monthly Average Range | Violation | Source |
| Distribution System | 4.0 ppm | 2.59 ppm | 1.91–2.59 ppm | No | Water additive used to control microbes |
Total Organic Carbon– Tested at Water Treatment Plants | |||||
|---|---|---|---|---|---|
| Treatment Technique Requirement | Baxter WTP One Year Average | Belmont WTP One Year Average | Queen Lane WTP One Year Average | Violation | Source |
| Percent of Removal Required | 25–45% | 25–45% | 25–45% | n/a | Naturally present in the environment |
| Percent of Removal Achieved* | 40–67% | 32–64% | 29–72% | No | |
| Number of Quarters out of Compliance | 0 | 0 | 0 | ||
| |||||
Turbidity, a measure of clarity– Tested at Water Treatment Plants | |||||
|---|---|---|---|---|---|
| Baxter WTP One Year Average | Belmont WTP One Year Average | Queen Lane WTP One Year Average | Violation | Source | |
| Treatment Technique Requirement: 95% of samples must be at or below 0.300 NTU | 100% below 0.300 NTU | 100% below 0.300 NTU | 100% below 0.300 NTU | n/a | Soil runoff, river sediment |
| Highest single value for the year | 0.096 NTU | 0.100 NTU | 0.141 NTU | No | |
The turbidity of Philadelphia’s water in 2022 was 86 percent below the maximum level of 0.3 NTU allowed by the State and Federal Regulations and was 57 percent below the Partnership for Safe Water turbidity goal of 0.1 NTU. We are required to monitor your drinking water for specific contaminants on a regular basis. Results of regular monitoring are an indicator of whether or not your drinking water meets health standards. PWD continuously operates and monitors water quality from a total of 160 filters at three drinking water treatment plants. In calendar year 2022, on one occasion, continuous on-line turbidity monitoring was interrupted on one of our filters and therefore we cannot be sure of the quality of the drinking water from this filter during the interruption. On June 1st, 2022 Filter #31 at the Queen Lane Drinking Water Treatment Plant was found in service without turbidity monitoring for a period of 86 hours. The monitoring interruption was a result of an instrumentation calibration procedural error that left the unit in hold mode creating an artificial steady turbidity reading, until operators recognized the data trend was not responding on June 5th, 2022. During this single filter monitoring interruption, the combination flow from the plant filters at Queen Lane Drinking Water Treatment Plant was continuously sampled and monitored with no change in turbidity levels. No water quality emergency occurred due to the monitoring interruption, and this notice is for informational purposes only. | |||||
Disinfection Byproducts | |||||
|---|---|---|---|---|---|
| Highest Level Allowed (EPA’s MCL) – One Year Average | Running Annual Average 2022* | System Wide Range of Resulsts | Violation | Source | |
| Total Trihalomethanes (TTHMs) | 80 ppb | 44 ppb | 15–66 ppb | No | Byproduct of drinking water disinfection |
| Total Haloacetic Acids (THAAs) | 60 ppb | 49 ppb | 15–76 ppb | No | Byproduct of drinking water disinfection |
| |||||
Unregulated Contaminant Monitoring (UCMR)1 | |||
|---|---|---|---|
| Chemical | Testing Period | Average | Range |
| Bromide2 | 1/14/2020 | 0.034 ppm | 0–0.052 ppm |
| Total Organic Carbon (TOC) | 1/14/2020 | 2.27 ppm | 2.19–2.34 ppm |
| HAA5 Total3 | 1/14/2020 | 21.3 ppb | 14.8–31.3 ppb |
| HAA6BR Total4 | 1/14/2020 | 7.1 ppb | 3.8–10.3 ppb |
| HAA9 Total | 1/14/2020 | 28.2 ppb | 23.6–35.5 ppb |
| Manganese | 1/15/2020 | 0.55 ppb | 0–0.95 ppb |
In 2020, PWD performed special monitoring as part of the Unregulated Contaminant Monitoring Rule (UCMR), a nationwide monitoring effort conducted by the EPA. Unregulated contaminants are those that do not yet have a drinking water standard set by the EPA. The purpose of monitoring for these contaminants is to help the EPA decide whether the contaminants should have a standard. For more information concerning UCMR, visit these websites: https://www.epa.gov/dwucmr/fourth-unregulated-contaminant-monitoring-rule or https://drinktap.org/Water-Info/Whats-in-My-Water/Unregulated-Contaminant-Monitoring-Rule-UCMR | |||
Unregulated contaminants not detected at any of the sampling locations: |
|---|
| 1-Butanol, 2-Methoxyethanol, 2-Propen-1-ol, alpha-Hexachlorocyclohexane, anatoxin-a, Butylated Hydroxyanisole, Chlorpyrifos, Cylindrospermopsin, Dimethipin, Ethoprop, Germanium, Microcystin Total, Nodularin, o-Toluidine, Oxyfluorfen, Permethrin Total, Profenofos, Quinoline, Tebuconazole, Tribufos |
Secondary Chemicals
EPA has established National Secondary Drinking Water Regulations (NSDWRs) that set non-mandatory water quality standards. EPA does not enforce these “secondary maximum contaminant levels” (SMCLs). They are established as guidelines to assist public water systems in managing their drinking water for aesthetic considerations, such as taste, color, and odor. These contaminants are not considered to present a risk to human health at the SMCL.
Secondary MCLs: Aesthetic Impacts in Tap Water | ||||||
|---|---|---|---|---|---|---|
| Chemical | EPA’s SMCL | Baxter WTP One Year Range | Belmont WTP One Year Range | Queen Lane WTP One Year Range | Violation* | Source |
| Chloride | 250 ppm | 55–102 ppm | 66–126 ppm | 58–162 ppm | No | Main component of many salts, may increase in winter months; Erosion of natural minerals; Used in the water treatment process in the form of ferric chloride. |
| Copper | 1.0 ppm | 0.002–0.196 ppm | 0.008–0.012 ppm | 0.025–0.057 ppm | No | Corrosion of coper pipes in premise plumbing; Erosion of natural deposits. |
| Fluoride | 2 ppm** | 0.76 ppm | 0.81 ppm | 0.74 ppm | No | Erosion of natural deposits; Water additive that promotes strong teeth; Discharge from fertilizer and aluminum factories. |
| Iron | 0.3 ppm | 0–0.026 ppm | 0–0.011 ppm | 0–0.011 ppm | No | Corrosion of iron water mains and premise plumbing; Erosion of natural minerals; Used in the water treatment process in the form of ferric chloride. |
| pH | 6.5-8.5 | 7.09–7.29 | 7.10–7.30 | 7.00–7.3 | No | Adjusted during the water treatment process. |
| Sulfate | 250 ppm | 7.30–17.00 ppm | 16.40–58.50 ppm | 9.02–58.10 ppm | No | Erosion of natural minerals; Runoff from mining operations. |
| Total Dissolved Solids | 500 ppm | 150–256 ppm | 216–374 ppm | 194–416 ppm | No | Erosion of natural minerals; May increase during winter months due to road salt runoff or during drought conditions. |
PWD also monitored for Aluminum, Color, Manganese, and Silver in 2022; all results were below respective parameter detection limits.
| ||||||
| Sources of Secondary Chemicals | |
|---|---|
| Chloride | Main component of many salts, may increase in winter months; Erosion of natural minerals; Used in the water treatment process in the form of ferric chloride. |
| Copper | Corrosion of coper pipes in premise plumbing; Erosion of natural deposits. |
| Fluoride | Erosion of natural deposits; Water additive that promotes strong teeth; Discharge from fertilizer and aluminum factories. |
| Iron | Corrosion of iron water mains and premise plumbing; Erosion of natural minerals; Used in the water treatment process in the form of ferric chloride. |
| pH | Adjusted during the water treatment process. |
| Sulfate | Erosion of natural minerals; Runoff from mining operations. |
| Total Dissolved Solids | Erosion of natural minerals; May increase during winter months due to road salt runoff or during drought conditions. |
Sodium, Hardness, and Alkalinity in tap water
The parameters listed below are not part of EPA’s requirements and are provided for information purposes.
WATER TIP :
Parameters like these matter if you use your water for activities like brewing beer or keeping a home aquarium.
Sodium in Tap Water | |||
|---|---|---|---|
| Baxter WTP One Year Average | Belmont WTP One Year Average | Queen Lane WTP One Year Average | |
| Average (ppm) | 24 ppm | 46 ppm | 41 ppm |
| Average (mg in 8 oz. glass of water) | 6 mg | 11 mg | 10 mg |
| Range (ppm) | 19–41 ppm | 31–61 ppm | 20–65 ppm |
| Range (mg in 8 oz. glass of water) | 4–10 mg | 7–14 mg | 5–15 mg |
Hardness in Tap Water | |||
|---|---|---|---|
| Baxter WTP One Year Average | Belmont WTP One Year Average | Queen Lane WTP One Year Average | |
| Average | 93 ppm or 5 gpg | 134 ppm or 8 gpg | 158 ppm or 9 gpg |
| Minimum | 75 ppm or 4 gpg | 100 ppm or 6 gpg | 87 ppm or 5 gpg |
| Maximum | 105 ppm or 6 gpg | 170 ppm or 10 gpg | 195 ppm or 11 gpg |
| Hardness defines the quantity of minerals, such as calcium and magnesium, in water. These minerals react with soap to form insoluble precipitates and can affect common household chores such as cooking and washing. Philadelphia’s water is considered “moderately hard” or “hard” depending on your service area. | |||
Alkalinity in Tap Water | |||
|---|---|---|---|
| Baxter WTP One Year Average | Belmont WTP One Year Average | Queen Lane WTP One Year Average | |
| Average | 40 ppm | 71 ppm | 71 ppm |
| Minimum | 26 ppm | 44 ppm | 32 ppm |
| Maximum | 52 ppm | 101 ppm | 93 ppm |
Glossary
Some of the words we use in the charts above may not be familiar to you. Here are definitions of technical and other terms.
- Action Level: The concentration of a contaminant which, if exceeded, triggers treatment or other requirements that a water system must follow. The action level is not based on one sample; instead, it is based on many samples.
- Alkalinity: A measure of the water’s ability to resist changes in the pH level and a good indicator of overall water quality. Although there is no health risk from alkalinity, we monitor it to check our treatment processes.
- E. coli (Escherichia coli): A type of coliform bacteria that is associated with human and animal fecal waste.
- gpg (grains per gallon): A unit of water hardness. One grain per gallon is equal to 17.1 parts per million.
- MCL (Maximum Contaminant Level): The highest level of a contaminant that is allowed in drinking water. MCLs are set as close to the MCLGs as feasible using the best available treatment technology.
- MCLG (Maximum Contaminant Level Goal): The level of a contaminant in drinking water below which there is no known or expected risk to health. MCLGs allow for a margin of safety.
- mg/L (Milligrams per liter): One milligram per liter is equal to one part per million.
- MRDL (Maximum Residual Disinfection Level): The highest level of disinfectant that is allowed in drinking water. The addition of a disinfectant is necessary for the control of microbial contaminants.
- MRDLG (Maximum Residual Disinfection Level Goal): The level of a disinfectant in drinking water below which there is no known or expected risk to health. MRDLGs do not reflect the benefits of the use of disinfectants to control microbial contaminants.
- Minimum Residual Disinfectant Level: The minimum level of residual disinfectant required at the entry point to the distribution system.
- NTU (nephelometric turbidity units): Turbidity is measured with an instrument called a nephelometer. Measurements are given in nephelometric turbidity units.
- Pathogens: Bacteria, virus, or other microorganisms that can cause disease.
- pCi/L (Picocuries per liter): A measure of radioactivity.
- ppm (parts per million): Denotes 1 part per 1,000,000 parts, which is equivalent to two thirds of a gallon in an Olympic-sized swimming pool.
- ppb (parts per billion): Denotes 1 part per 1,000,000,000 parts, which is equivalent to half a teaspoon in an Olympic-sized swimming pool.
- ppt (parts per trillion): Denotes 1 part per 1,000,000,000,000 parts, which is equivalent to one drop in 20 Olympic-sized swimming pools.
- Service Line: The pipe that brings water from the water main into your home or business.
- SMCL (Secondary Maximum Contaminant Level): Non-enforcable Federal water quality guidelines that are established for managing aesthetic and cosmetic conditions of water (e.g. taste, odor, color).
- SOC (Synthetic Organic Chemical): Commercially made organic compounds, such as pesticides and herbicides.
- Total Coliform: Coliforms are bacteria that are naturally present in the environment. Their presence in drinking water may indicate that other potentially harmful bacteria are also present.
- THAAs (Total Haloacetic Acids): A group of chemicals known as disinfection byproducts. These form when a disinfectant reacts with naturally occurring organic and inorganic matter in the water.
- TOC (Total Organic Carbon): A measure of the carbon content of organic matter. This measure is used to indicate the amount of organic material in the water that could potentially react with a disinfectant to form disinfection byproducts.
- TTHMs (Total Trihalomethanes): A group of chemicals known as disinfection byproducts. These form when a disinfectant reacts with naturally occurring organic and inorganic matter in the water.
- Treatment Technique: A required process intended to reduce the level of a contaminant in drinking water.
- Turbidity: A measure of the clarity of water related to its particle content. Turbidity serves as an indicator for the effectiveness of the water treatment process. Low turbidity measurements, such as ours, show the significant removal of particles that are much smaller than can be seen by the naked eye.
- VOC (Volatile Organic Chemicals): Organic chemicals that can be either man-made or naturally occurring. These include gases and volatile liquids.
- WTP: Water Treatment Plant
- μg/L (Microgram per liter): One microgram per liter is equal to one part per billion.
Top Customer Questions
How do I get my water tested?
We offer free lead and copper tests for residential customers who have concerns about their water.
To request an appointment Call (215) 685-6300
How hard is Philadelphia’s water?
Philadelphia’s water is considered moderately hard. Hardness depends on the treatment plant that serves your area of the city.
Why does water have an earthy flavor sometimes?
Earthy or musty flavors occur naturally in drinking water and are among the most commonly reported worldwide. When certain algae-type organisms grow in our rivers, detectable levels of these odors can make their way into the treated drinking water.
These natural compounds have no known health effects at their natural levels, and are found in various foods.
We take steps to reduce their presence when detected.
Why do water utilities add fluoride to water?
It’s a natural element that helps prevent cavities. Philadelphia’s Health Department (and dentists) recommend that we add fluoride to a level that helps protect children’s teeth.
Can I replace a lead service line?
Yes. If you don’t want to contact a plumber directly, apply for our Homeowners Emergency Loan Program (HELP).
A zero-interest loan can cover the cost of replacement.
Also: PWD will replace lead service lines for free if they are discovered during planned work on water mains.
Why does my tap water smell like a pool sometimes?
The smell of chlorine means your water is safe and treated to remove harmful organisms. You can reduce the smell by keeping a pitcher of fresh water in the refrigerator. This also reduces the earthy odor sometimes produced by algae in the rivers during spring.
Working together
You can help protect Philadelphia’s water quality.
Keep trash out of our waterways.
Protect our rivers and streams by properly disposing of garbage and recyclable materials.
Don’t flush anything but toilet paper.
Even “flushable” wipes can lead to clogs and backups affecting our homes and streets.
Always properly recycle or dispose of household hazardous wastes.
Don’t flush them down the toilet or down the sink, and don’t pour them into storm drains.
Stay informed
Sign up for email or text message updates from PWD.

Get the latest news, useful information, and find out about upcoming events. Sign up for email and text alerts at water.philagov/signup.
Sharing this report
Please share this report with all people who drink this water, especially those who may not have received this notice directly (for example, people in apartments, nursing homes, schools and businesses). You can do this by posting this notice in a public place or distributing copies by hand and mail.
To receive a printed copy of this report, please email: waterquality@phila.gov
People with special health concerns
Some people may be more vulnerable to contaminants in drinking water than the general population. Immunocompromised persons, such as persons with cancer undergoing chemotherapy, persons who have undergone organ transplants, people with HIV/AIDS and other immune system disorders, and some elderly people and infants can be particularly at risk from infections. These people should seek advice about drinking water from their health care providers.
U.S. Environmental Protection Agency (EPA)/Centers for Disease Control (CDC) Guidelines on appropriate means to lessen the risk of infection by Cryptosporidium and other microbial contaminants are available from the Safe Drinking Water Hotline: (800) 426-4791.
Philadelphia Water Department
1101 Market Street
Philadelphia, PA 19107
(215) 685-6300 • water.phila.gov
Images: JPG Photo & Video, Sahar Coston-Hardy, Philadelphia Water Department