
Drinking Water Quality Report
2025 • Published in 2026
PWD’s Public Water System Identification #PA1510001
Introduction
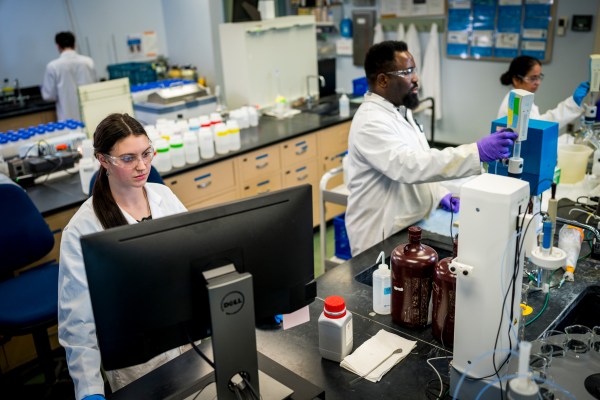
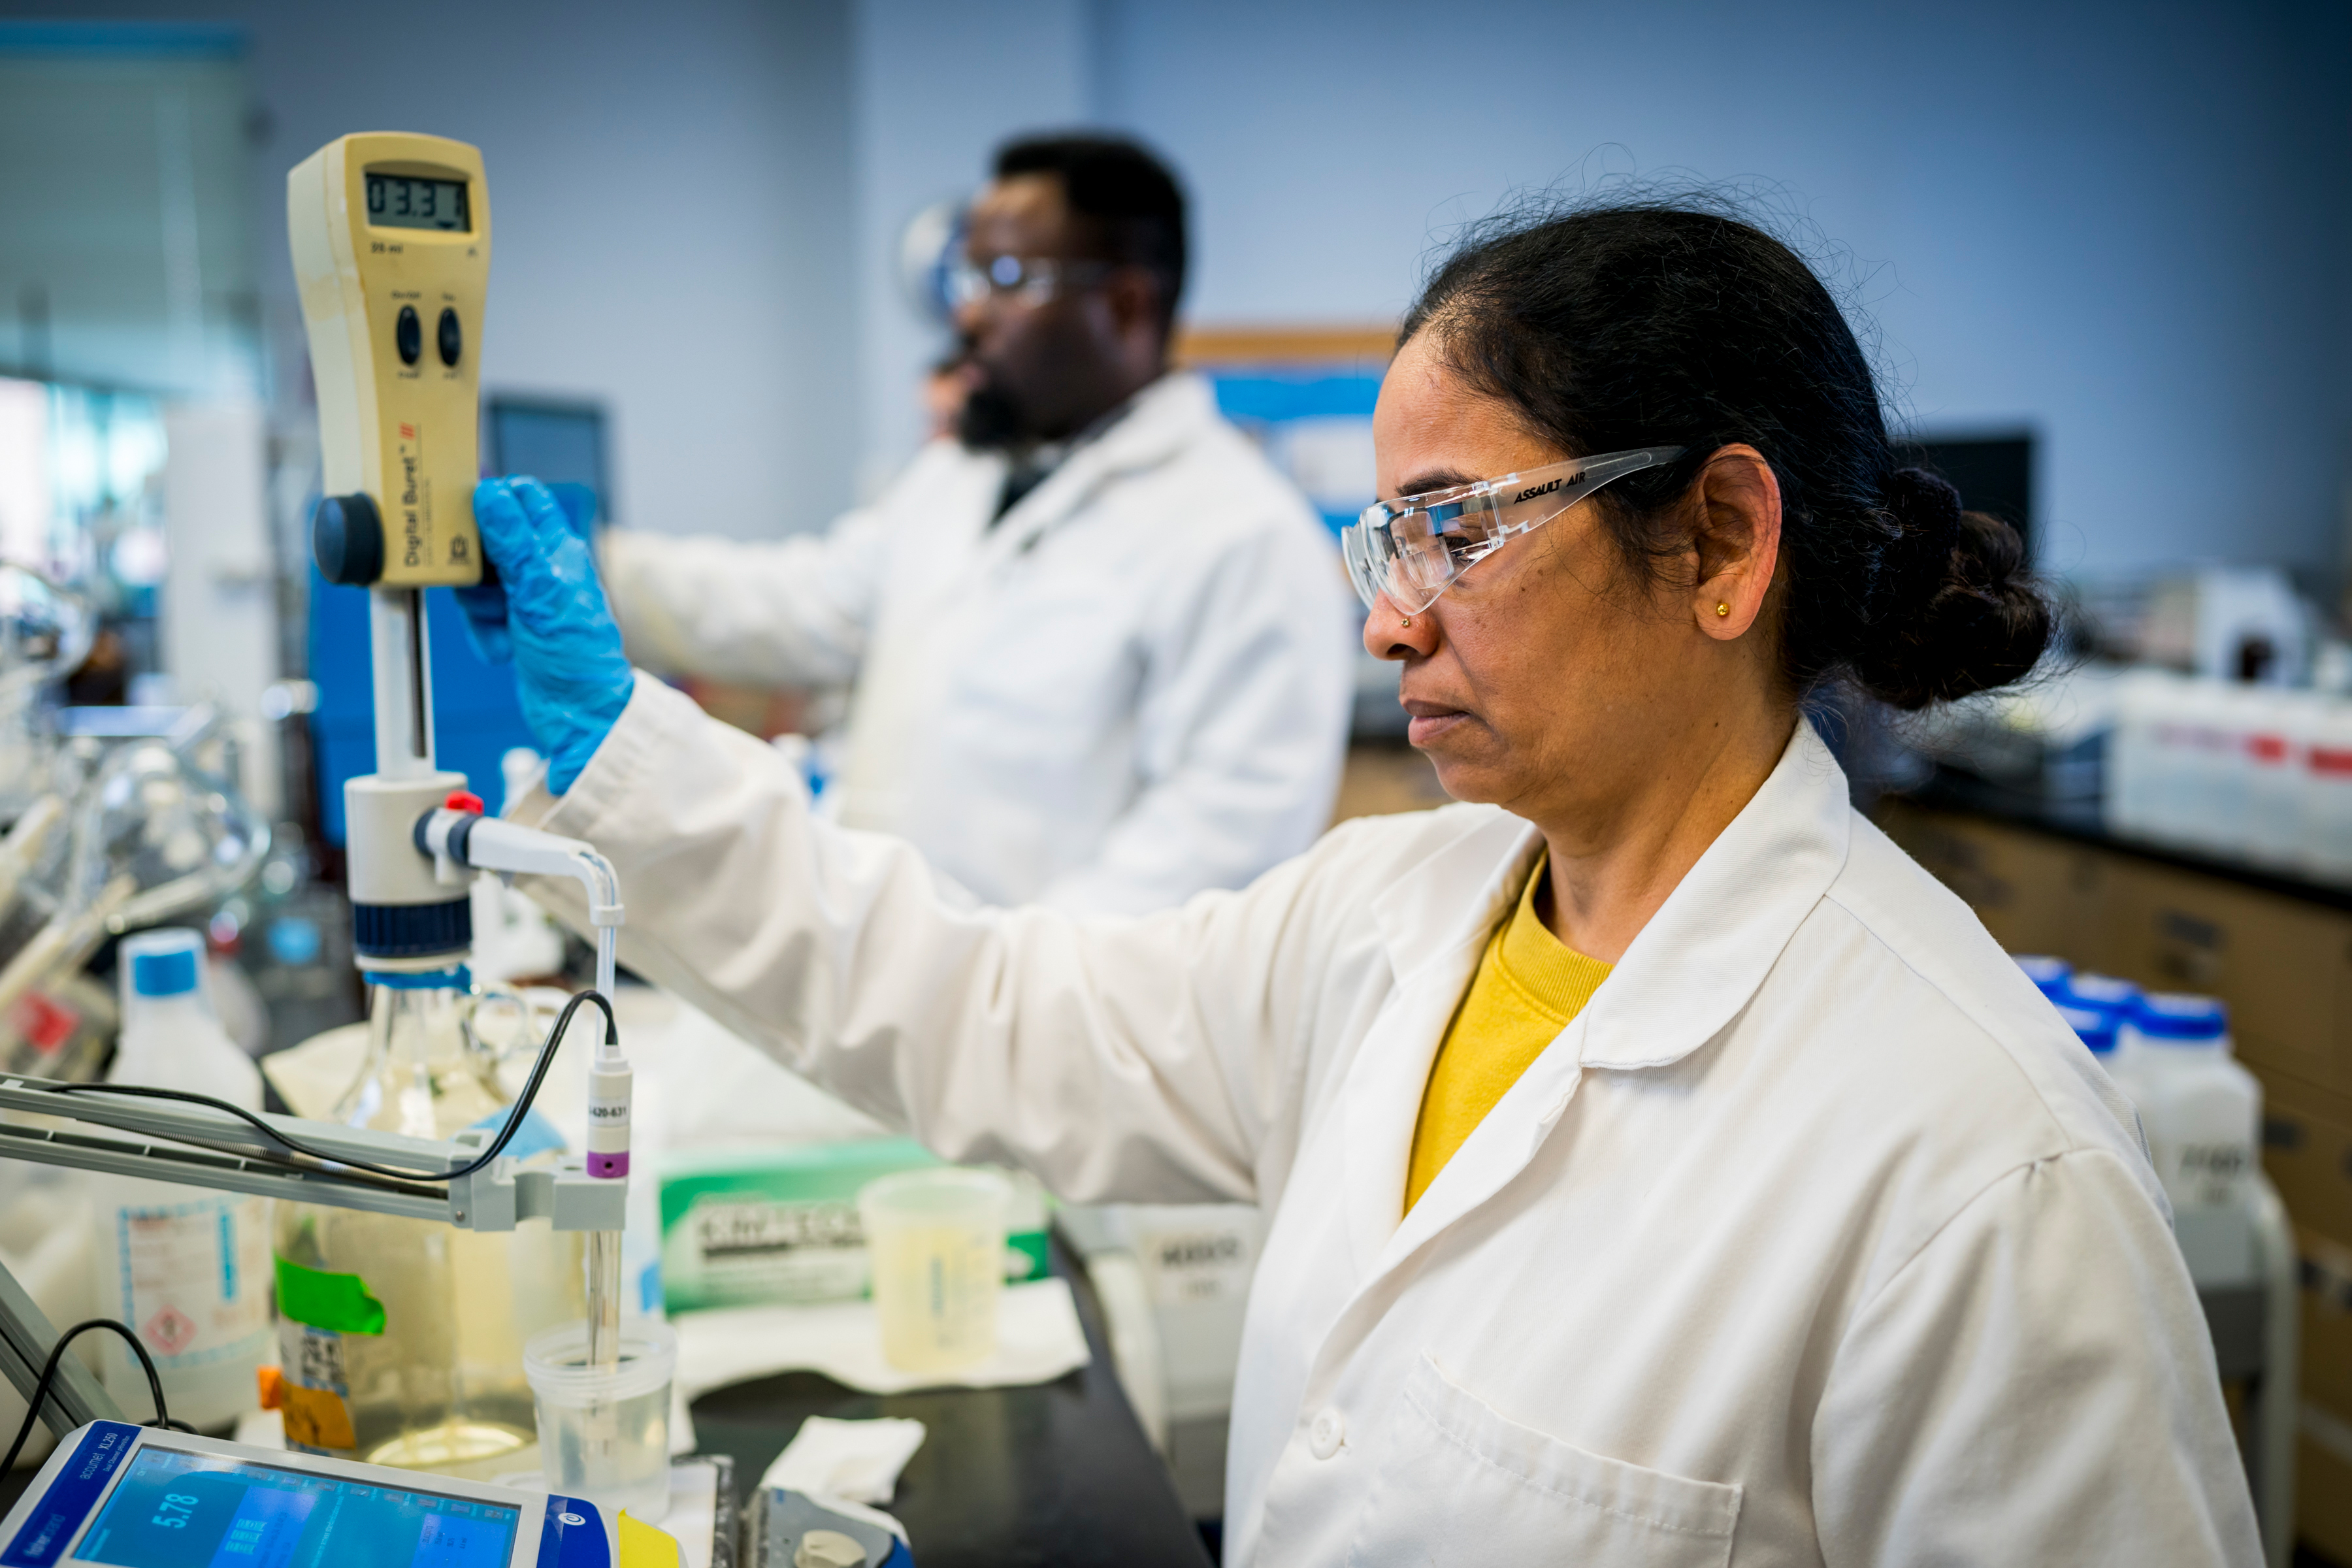
We’re proud to protect your water


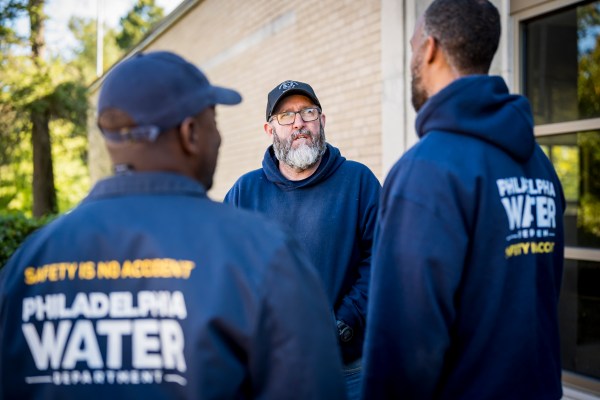

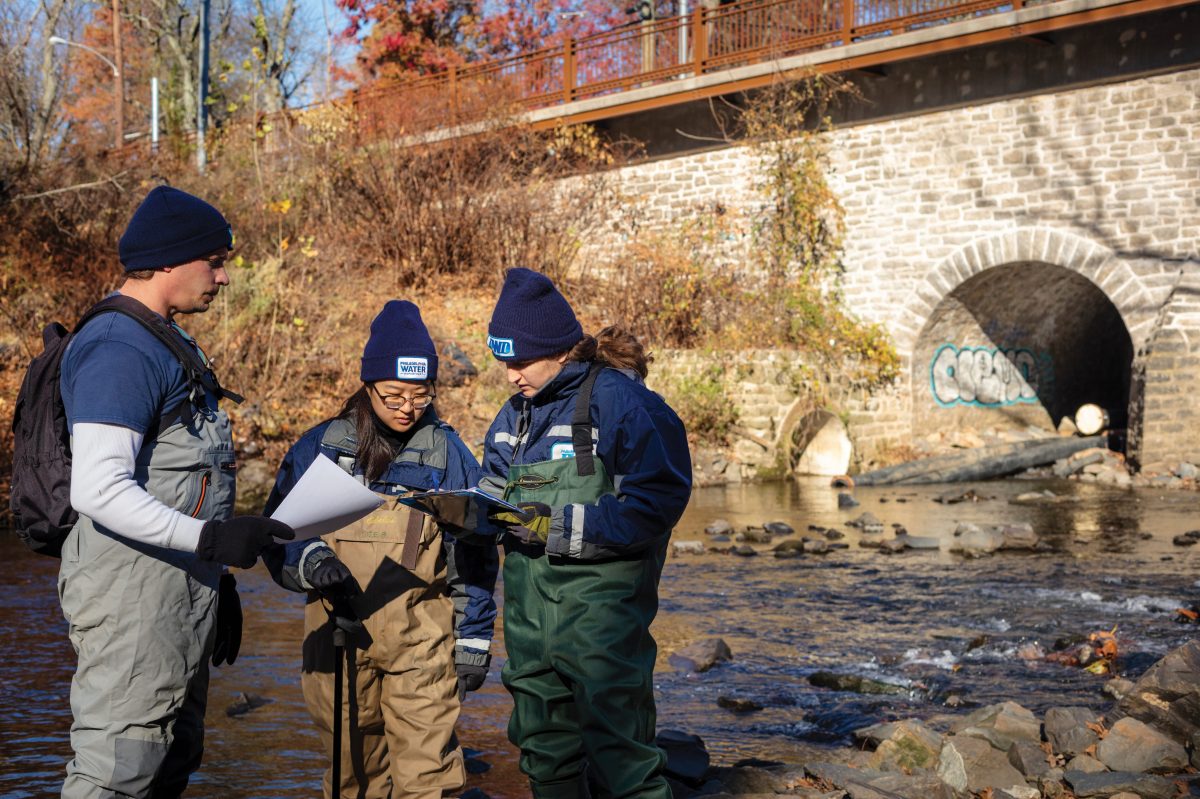
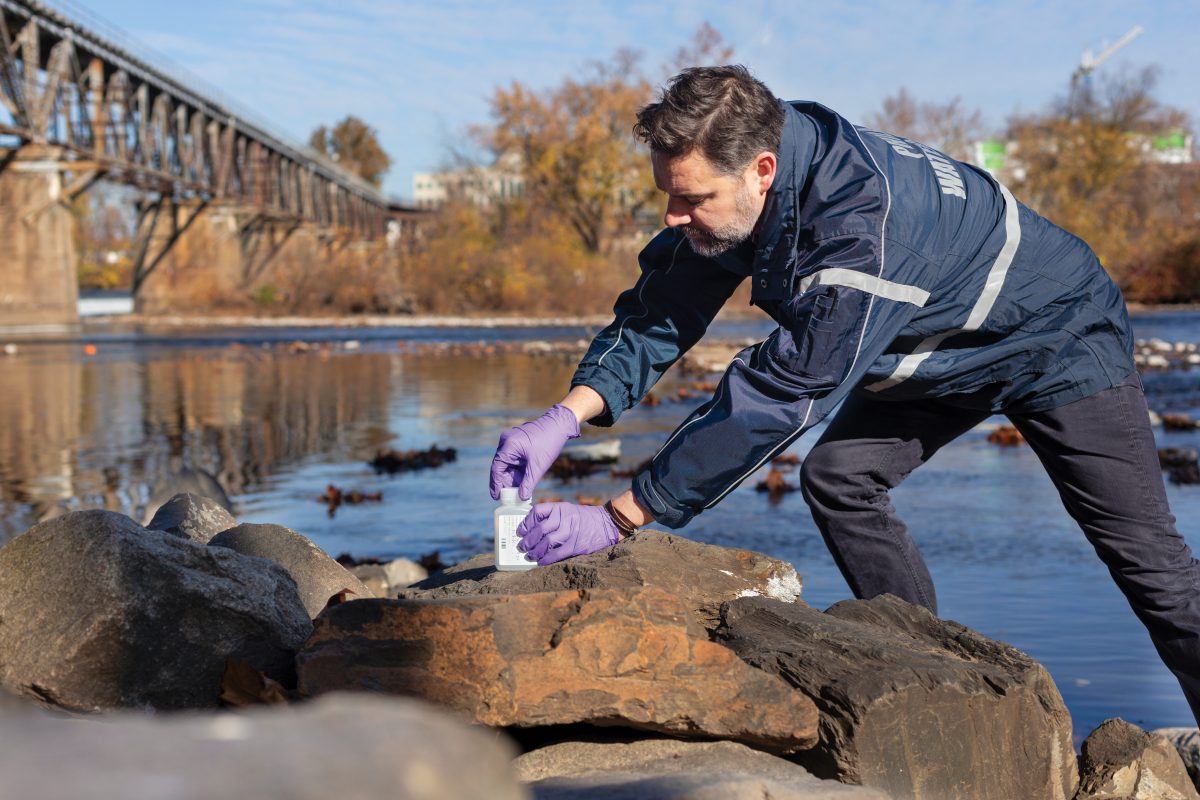
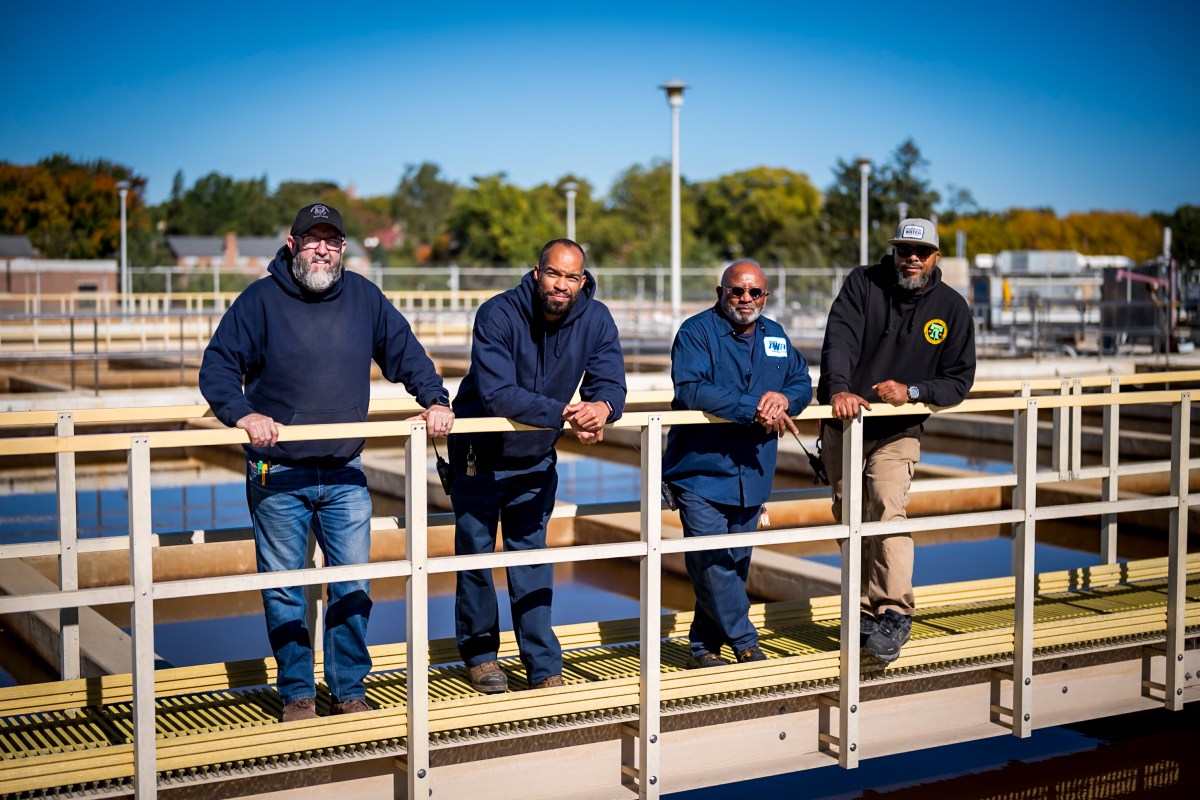
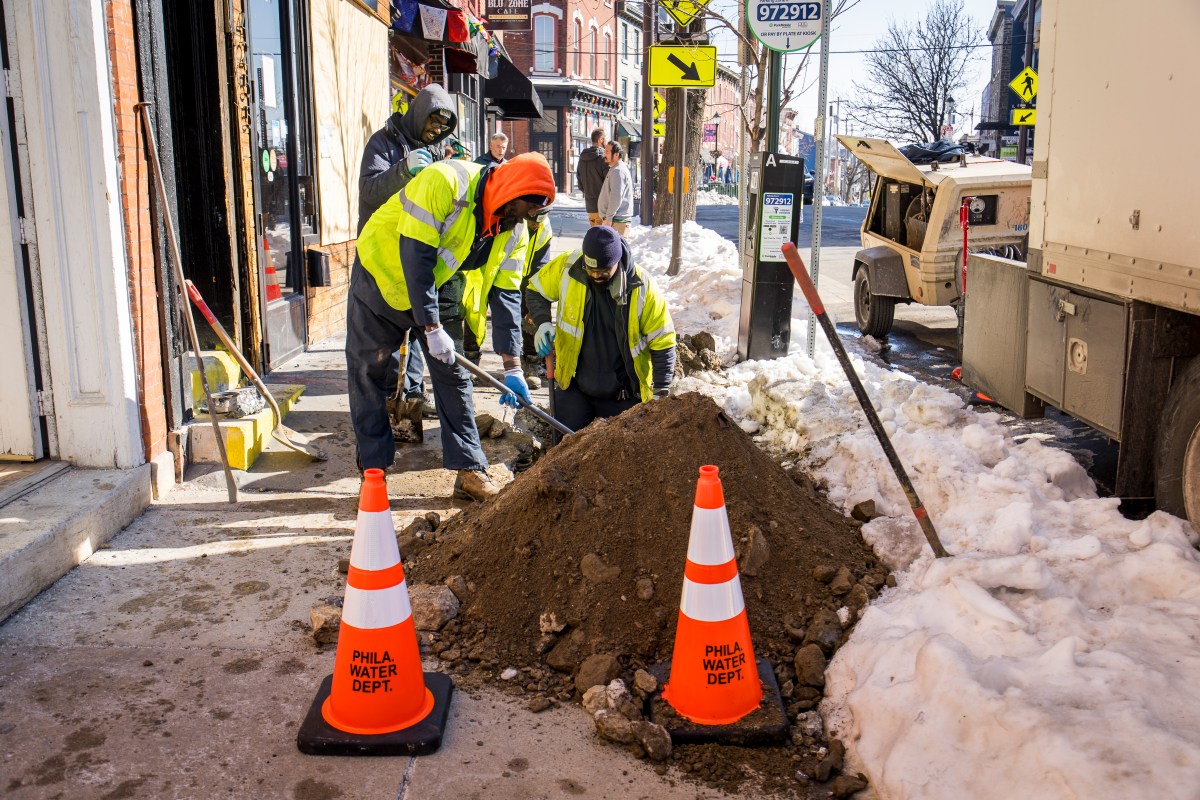
Our staff live and work in Philadelphia.
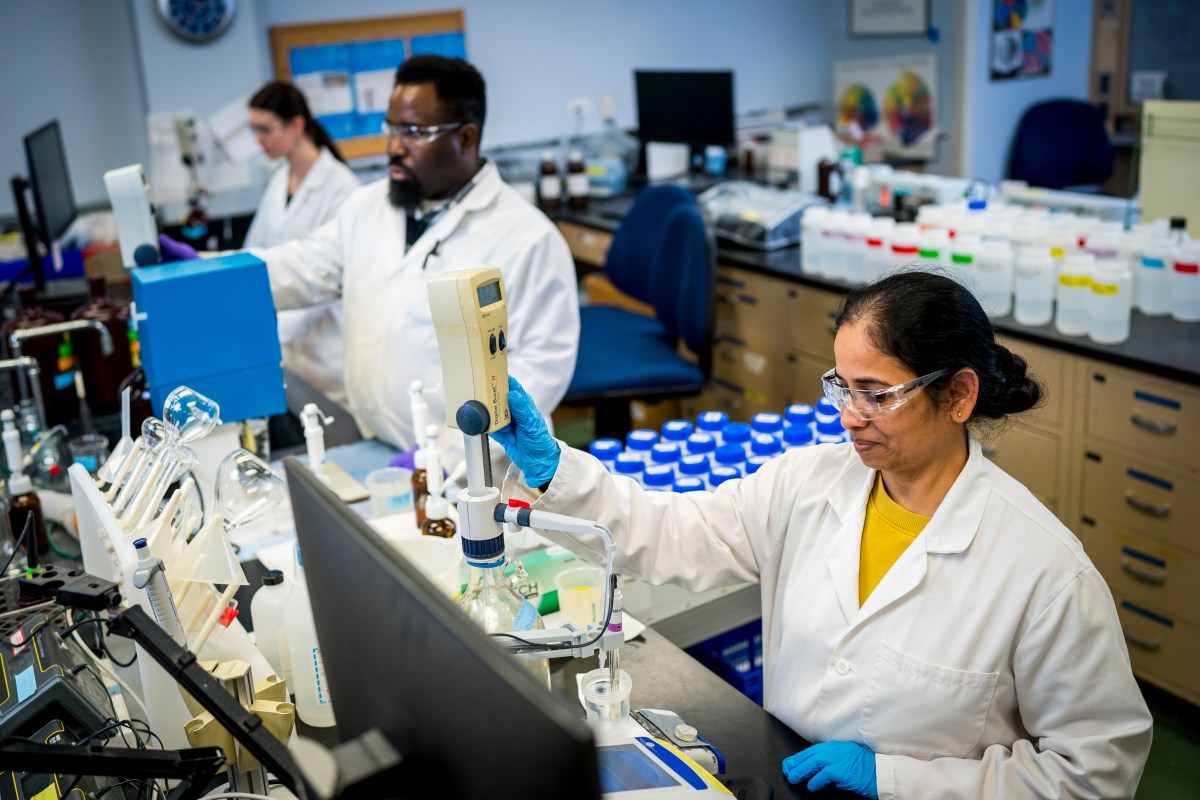
We test and monitor at every step: from the rivers, through treatment, and to distribution. Customer service supports it all.
We welcome you to the 2026 Drinking Water Quality Report!
This annual document demonstrates how we protect Philadelphia’s drinking water from the source to the tap. Our staff is dedicated to ensuring safe, reliable drinking water. We deliver top-quality water to Philadelphia’s homes, businesses, and communities 24 hours a day, every day.
We are planning for tomorrow – and for years to come. These crucial plans address residents’ top water quality concerns, including removing lead plumbing and “forever” chemicals like PFAS, as shown in responses to our latest annual customer survey.
We are piloting new programs to find and remove lead from plumbing in properties across the city over the next decade. We’re also offering free water testing for lead at local schools and childcare facilities.
We are upgrading our drinking water treatment plants with advanced technology to prepare for new Per- and Polyfluoroalkyl Substances (PFAS) regulations when they take effect.
The decades-long Water Revitalization Plan will enable us to continue providing safe, reliable drinking water for future generations, thanks to multiple infrastructure projects and upgrades. The work makes our system more resilient for emergencies.
All of this essential work aligns with our five-year Strategic Plan, including building resilient infrastructure and supporting operational excellence. Through responsible spending, we keep the work as cost-efficient as possible for our customers.
For PWD staff, we know the importance of tap water you can trust—and we will continue to deliver.
Sincerely,
Ben Jewell, Commissioner
Contact Information
Philadelphia Water Department
1101 Market St.
Philadelphia, PA 19107
Public Water System ID #PA1510001
Paul Fugazzotto II
Assistant Deputy Commissioner, Public Affairs
(215) 683-3428
People with special health concerns
Some people may be more vulnerable to contaminants in drinking water than the general population.
Immuno-compromised persons, such as persons with cancer undergoing chemotherapy, persons who have undergone organ transplants, people with HIV/AIDS and other immune system disorders, and some elderly people and infants can be particularly at risk from infections. These people should seek advice about drinking water from their health care providers.
U.S. Environmental Protection Agency (EPA)/Centers for Disease Control (CDC) guidelines on appropriate means to lessen the risk of drinking water contaminants are available from the Safe Drinking Water Hotline: (800) 426‑4791.
Table of Contents

Inside the report

Survey says…!
We’ve included some common customer questions based on recent survey data.
Look for this symbol throughout the document. You’ll find answers and information about common customer concerns.
 A closer look
These quick guides are included to help interpret some of the tests we do.
The charts and graphs help you see the data in a new way. We include information on how and why we do these tests, and what it means for you!
You can find the full data tables at the end of the report.
1 | Source
Your water begins in freshwater streams

Protection starts at the sources
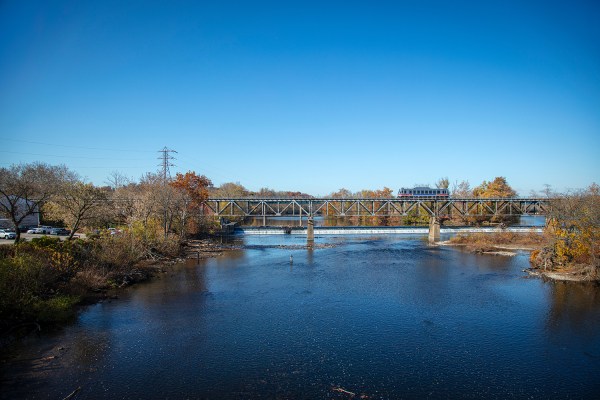
Philadelphia’s water comes from the Delaware River Watershed. The watershed begins in New York State and extends 330 miles south to the mouth of the Delaware Bay. Both the Schuylkill and Delaware Rivers are part of the Delaware River Watershed.
We take a holistic approach, beginning with Philadelphia’s water supply. We monitor waterways across the watershed and look for potential sources of contamination. We keep track of water availability and flow.
Our wide range of tools for protecting water sources includes:
Research
- We study regional influences, such as natural gas drilling, and global change, like sea level rise.
Projects in the field
- We protect against stormwater and agricultural runoff.
- We monitor contaminants and evaluate how they may affect our drinking water.
Partnerships
- We team up with organizations across the region to protect our entire watershed.
Emergency Response
- We use advanced computer modeling and notification systems to protect against spills and accidents that happen upstream.
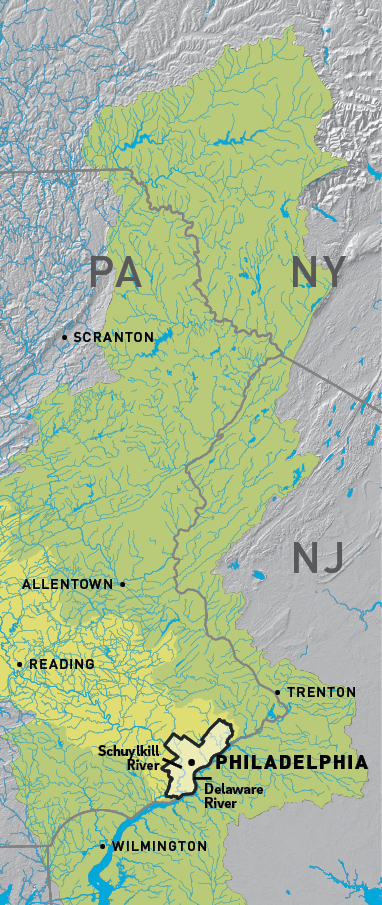
Philadelphia’s source watersheds
Delaware River Watershed
Schuylkill River Watershed
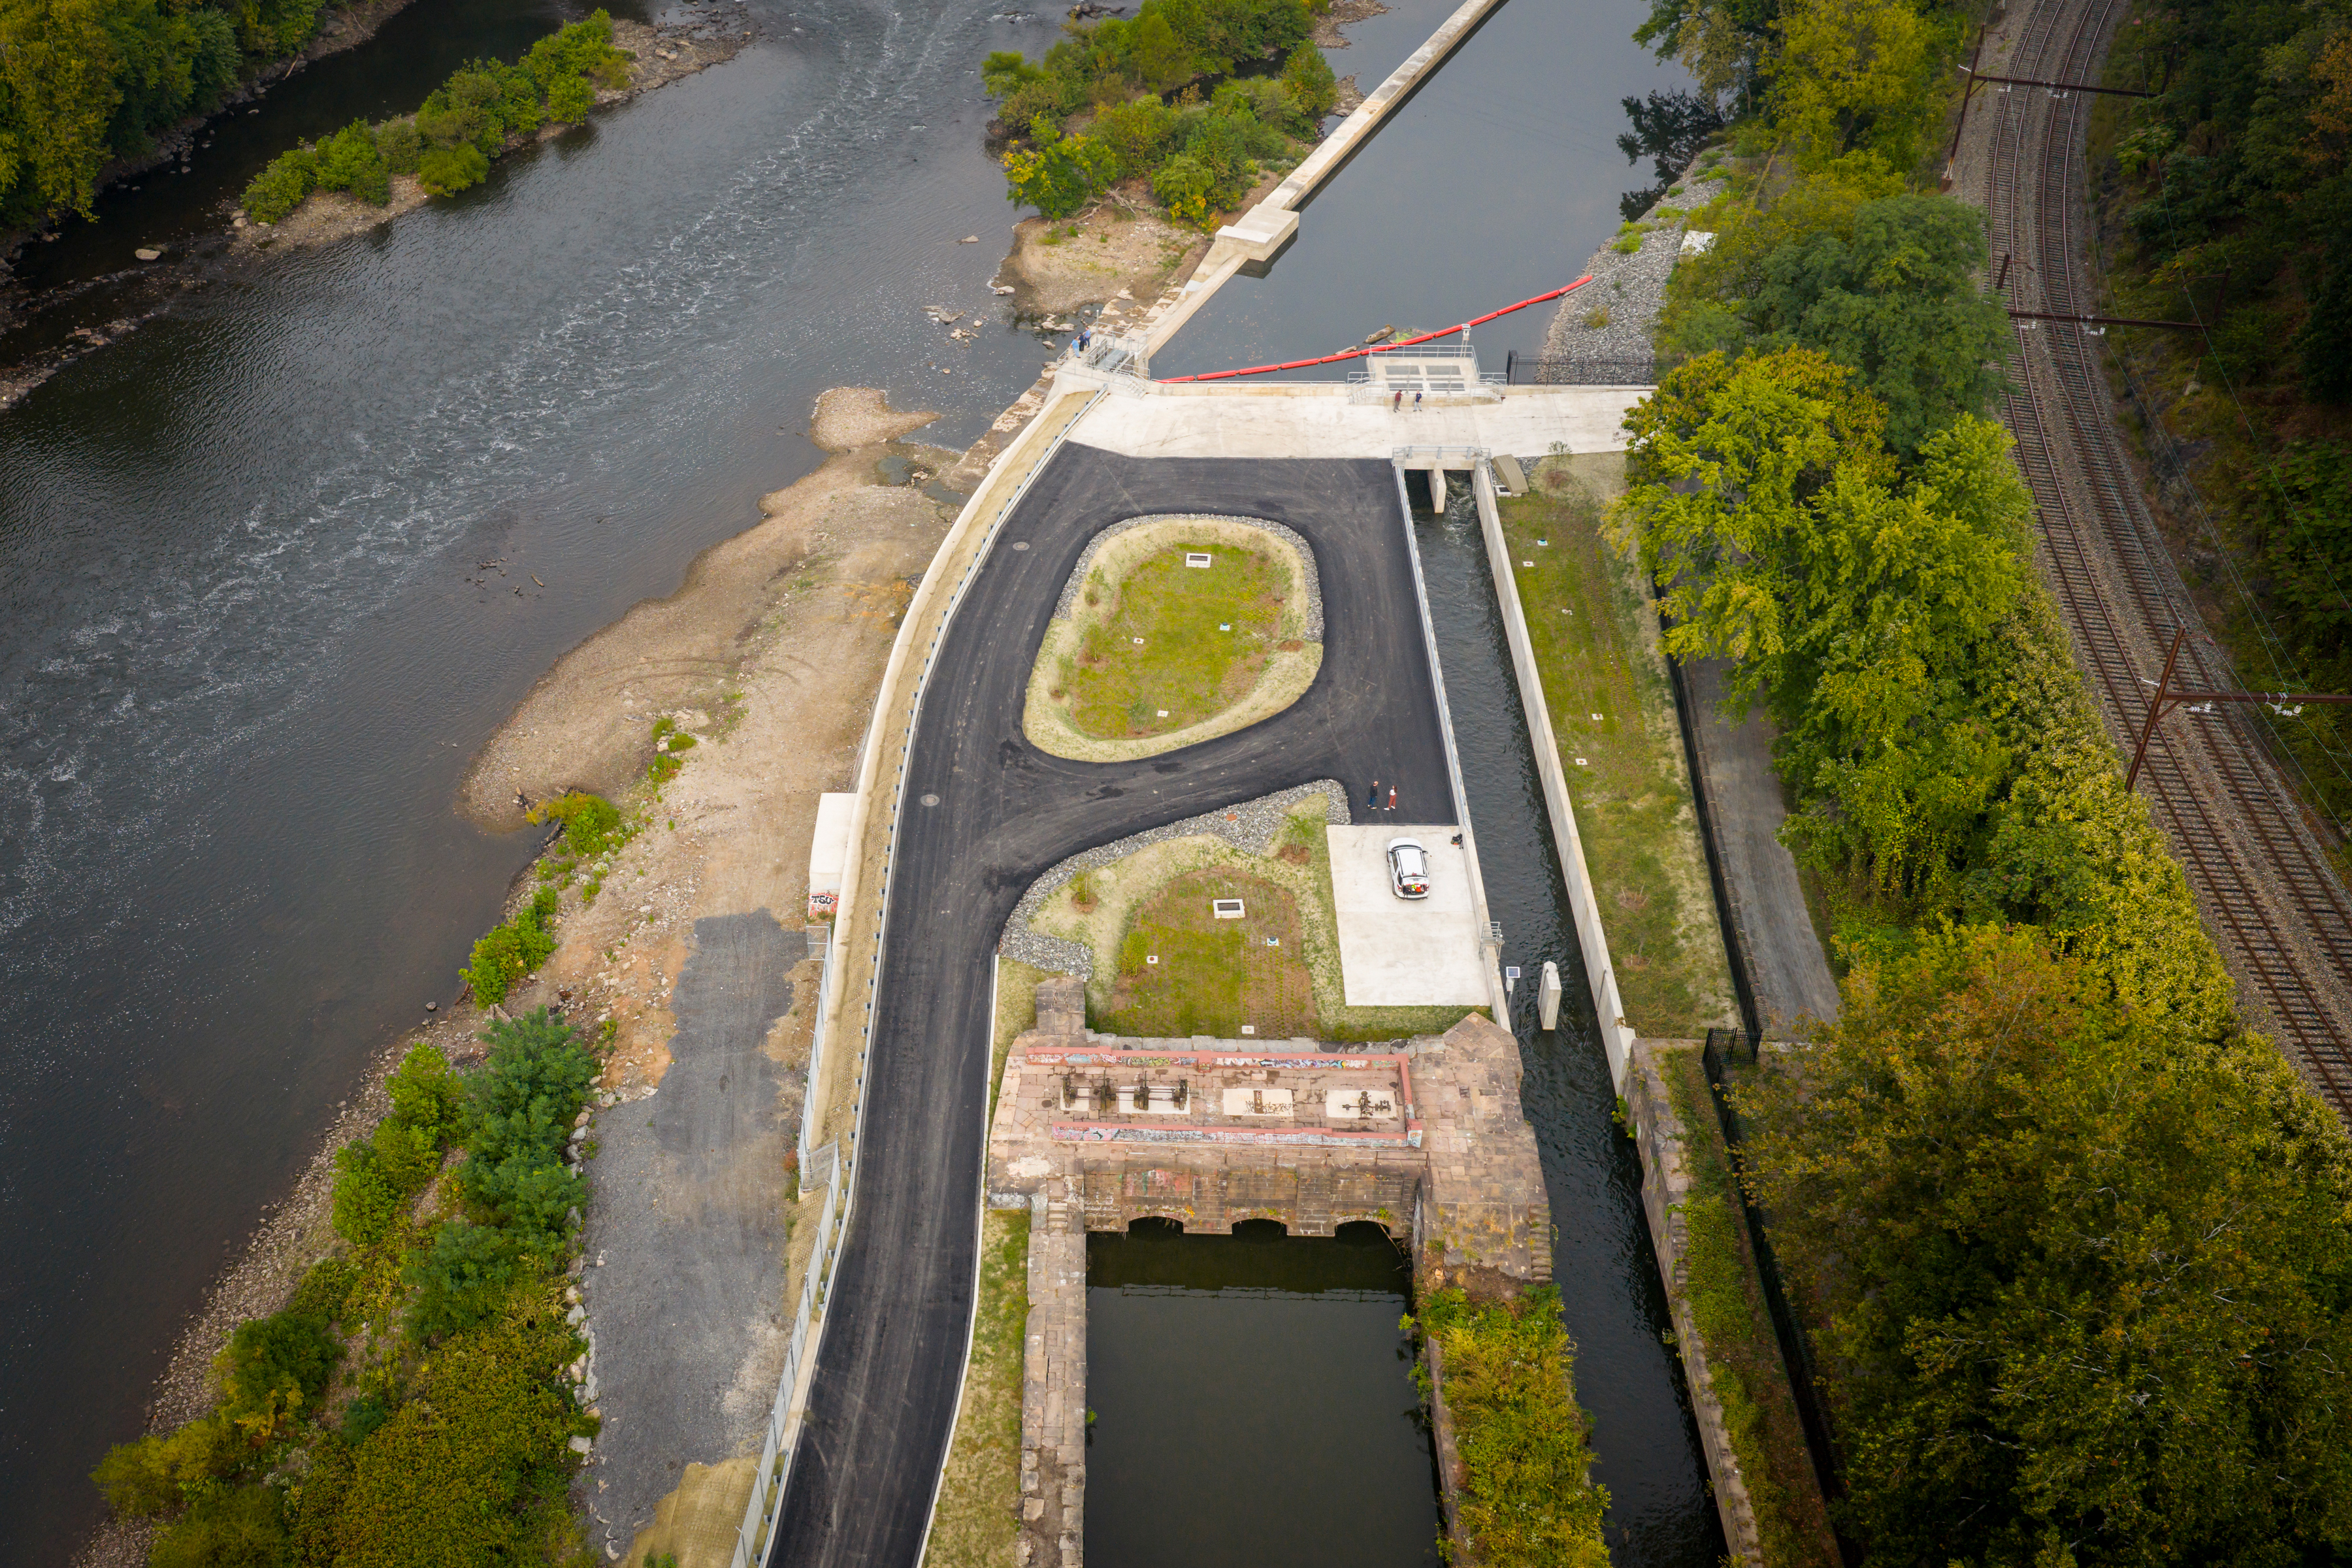
Improving local water quality
We recently reconnected the Manayunk Canal with the Schuylkill River, reintroducing fresh water flow at the Flat Rock Dam.
A historic dam
Flat Rock Dam supported local industry from the 1820s to the 1940s by funneling water into the factory-lined Manayunk Canal.
The canal was closed in the 1940s. Fresh water flow was cut off for decades, leading to stagnant water, algal blooms, odors, and trash.
Restoring the canal
We built new structures to connect the waterways. A new intake system will control the flow of water into the canal, as needed. These upgrades help improve water quality and protect our water sources.
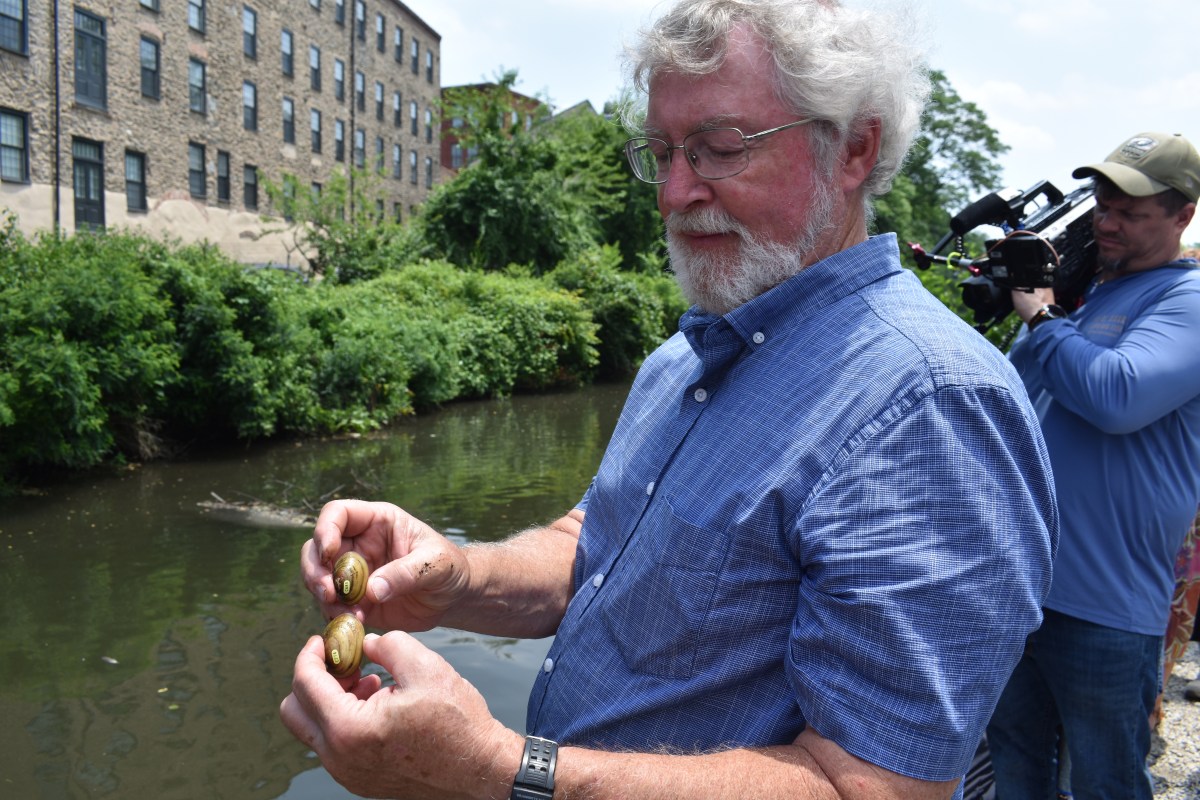
A successful first year
In the year or so since flow has returned to the Manayunk Canal, we’ve seen dramatic improvements in the water quality in the canal.
Wildlife, like herons, highlight the canal’s water quality. PWD introduced mussels to study their impact on water quality in the canal.

2 | Treatment
Drinking Water Treatment Plants
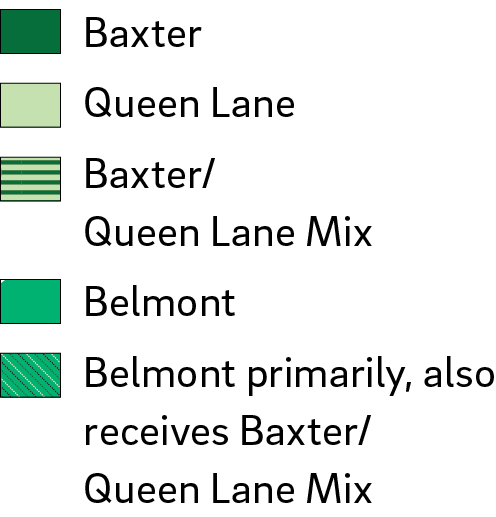
We have three drinking water treatment plants.
Baxter pulls water from the Delaware River. Queen Lane and Belmont draw from the Schuylkill.
Each plant has a service area. Some areas in Philadelphia receive a mix from multiple treatment plants.
Treatment plants are an early and important step in water’s journey.
Use this map or enter your address to see where your water is treated:

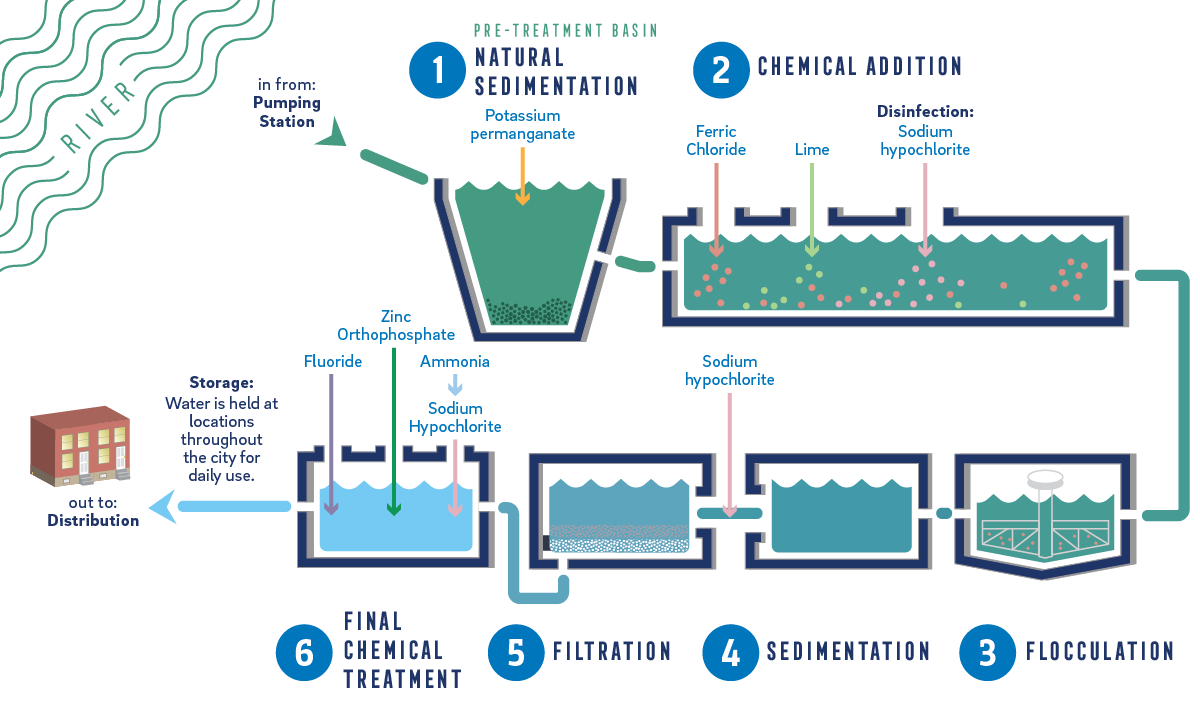
Typical Treatment Process
These are some of the stages water goes through during normal operating conditions.
 Top customer question:
What is PWD doing about “forever” chemicals like PFAS?
Background
Per- and Polyfluoroalkyl Substances (PFAS) are a group of long-lasting, harmful chemicals used in consumer products. Our goal is to ensure your water is safe.
We have monitored for PFAS in our source water since 2020. Our routine tests show levels are consistently low.
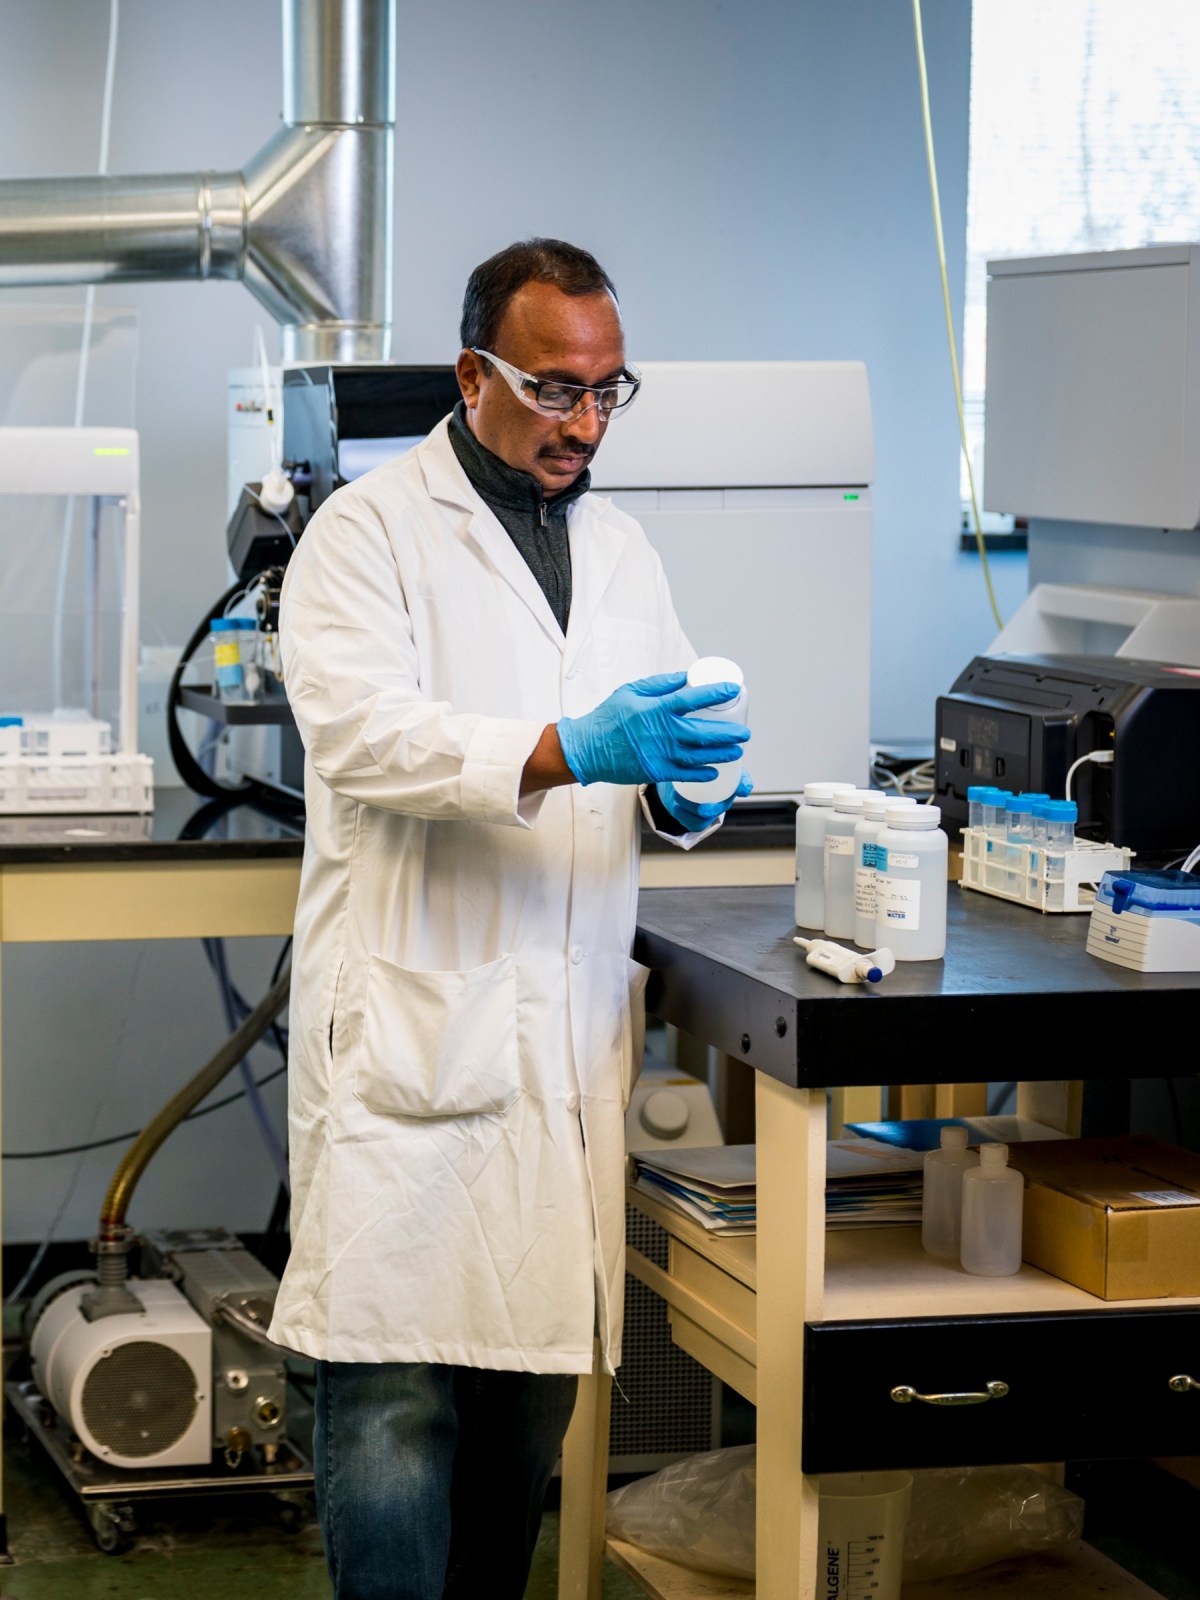
What we’re doing at our facilities
Scientists at PWD are evaluating options to effectively remove PFAS during treatment.
We’ve identified Powdered Activated Carbon (PAC) as a potential solution because our levels are consistently low.
We already use PAC occasionally to address taste and odor concerns. We’re adding more PAC storage and treatment capacity to continuously remove PFAS at our Water Treatment Plants.
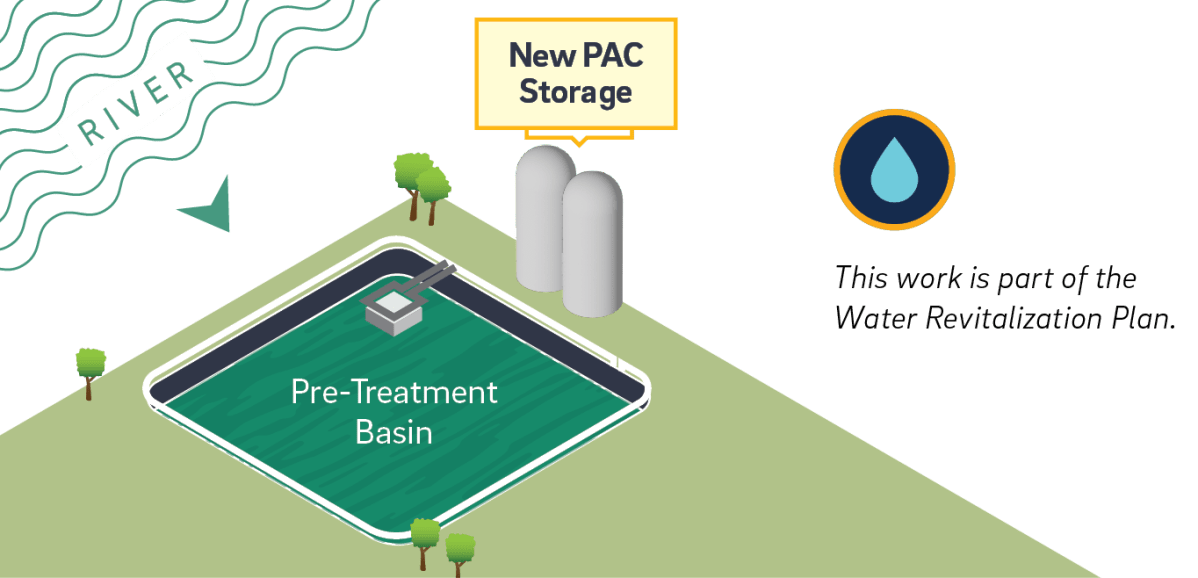
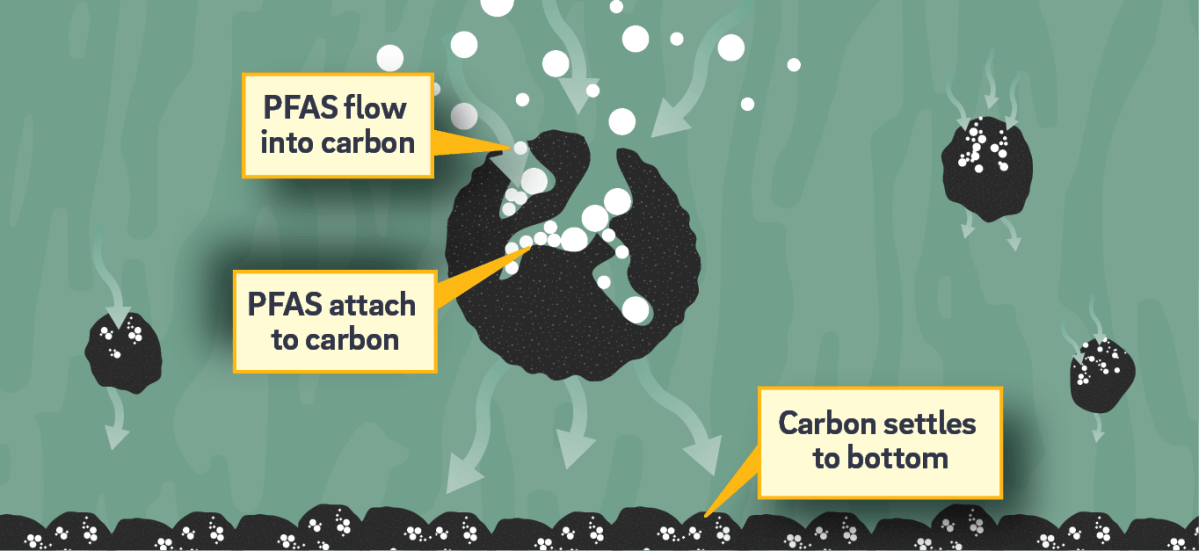
How PAC works
PAC is added to water at the treatment plant. Microscopic PFAS particles attach to the surface and to the inside of the carbon. The PAC then settles to the bottom of the basin, and the water continues on in the treatment process.
Before water leaves the plant
We test our treated water for about 100 regulated contaminants, ranging from organisms, such as bacteria, to chemicals, such as nitrate.
Final touches
Chlorine + Ammonia
Chlorine protects us from organisms found in untreated water that can cause disease. Ammonia is added to make the chlorine last longer and reduce the bleach-like smell.
Fluoride
All water contains some fluoride. We adjust the natural levels slightly to help protect your teeth against decay.
Zinc orthophosphate
Zinc orthophosphate is a compound that helps form a protective coating inside pipes. It prevents corrosion (or breaking down over time).
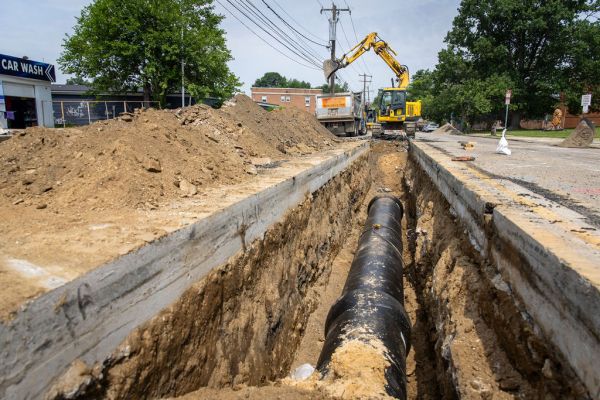
3 | Delivery
A safe path through the system
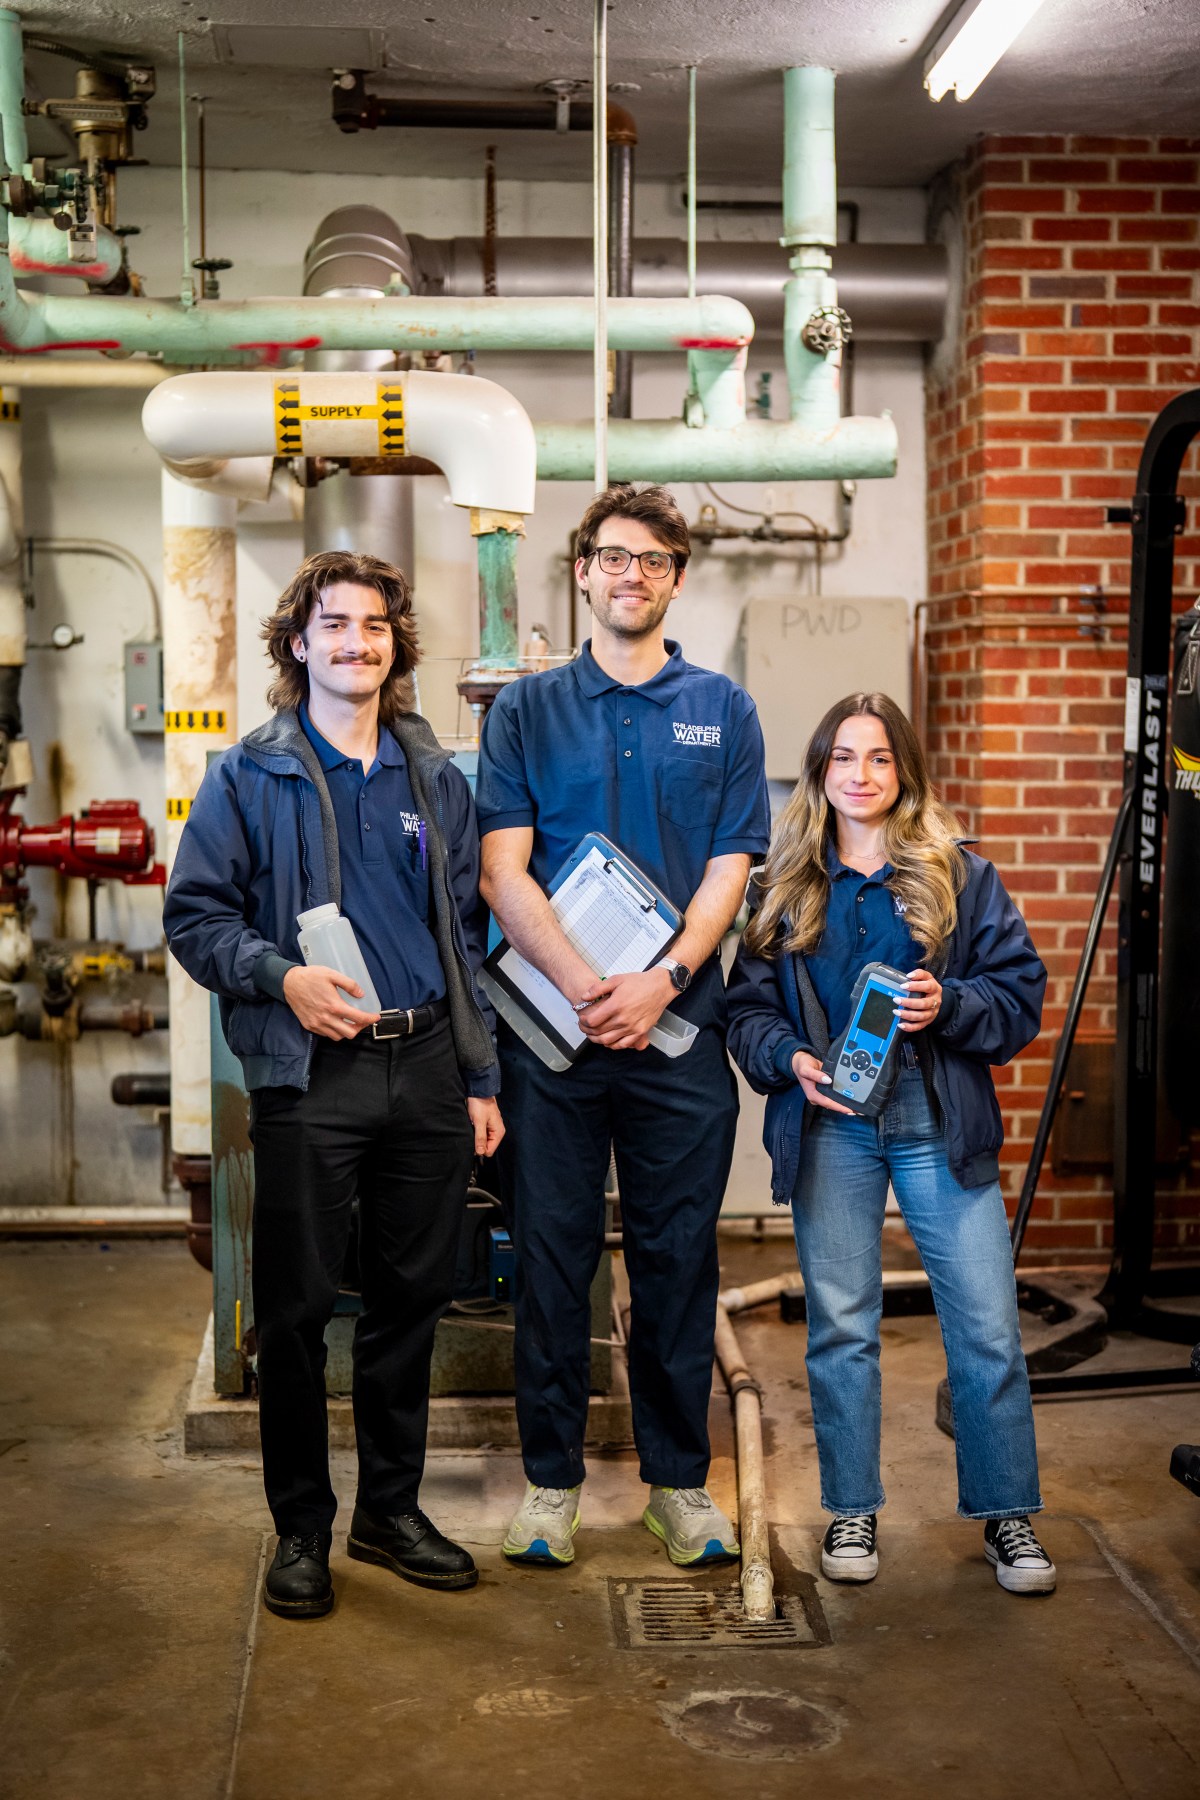
We have about 3,100 miles of water mains that deliver clean tap water to customers.
To ensure water stays safe as it moves from the plant to you, we take samples and monitor real-time water quality data 24/7.
 Top customer question:
Why does my water smell like chlorine sometimes?
We hear from customers who tell us their water sometimes smells like chlorine. Taste and odor concerns are common, and we care about these things, too!
We use chloramine (a combination of chlorine and ammonia) for disinfection. Chloramine plays an important role in our drinking water treatment: protecting us from organisms that can cause disease.
Our process
We add chlorine when water enters our drinking water treatment plants. We add ammonia to change chlorine to chloramine before it leaves our treatment plants.
We monitor levels to make sure they stay within ranges that meet our standards and regulatory requirements.
We test for residual chlorine levels throughout our distribution system, too. Residual chlorine is part of the disinfection process. We collect samples from a range of City-owned buildings, like fire stations, police stations, and other facilities.
A smell or taste of chlorine is normal for our system. We do everything possible to deliver great-tasting (and safe) drinking water.
A common concern
Last year, 1 in 5 calls from customers about taste and odor were about chlorine. Taste and odor concerns also make up about 20% of concerns from our annual customer survey respondents.
Did you know?
Seasonal changes can impact taste and odor. Warmer water temperatures in the summer can reduce chloramine levels. Colder weather can make the smell more noticeable.
A closer look Residual Chlorine
Tested throughout the distribution system.
Most recent results:
What the data means for you
These tests confirm we have the proper levels of disinfection. The data means we know the water is safe after it leaves the treatment plants!
Bottom line
Better than standards.
4 | At your taps
Water where you live, work, and play.
When water leaves a water main, it enters a property’s service line. From there, the property’s plumbing system carries water to the taps or fixtures we use every day at home, school, or work.
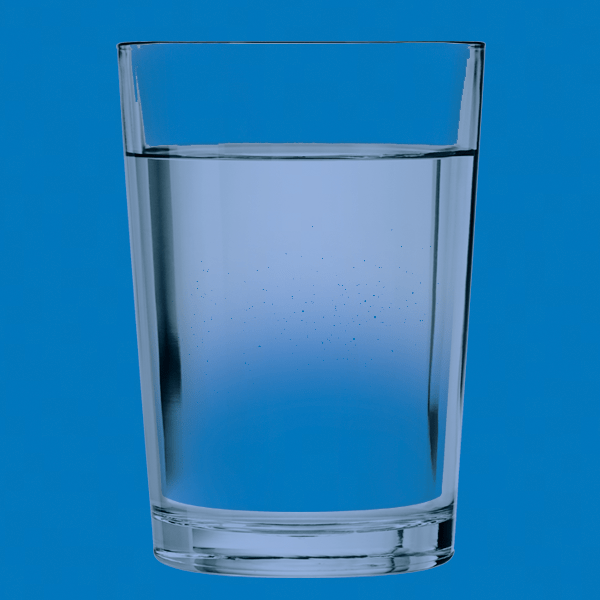
Does your tap water appear cloudy?
This is usually not a water quality issue. Pressure in the water main creates air bubbles in water. When you fill a glass with tap water, the bubbles rise from the bottom of the glass and are released at the top.
Contact us to report a water quality issue if the bubbles don’t disappear after a few seconds.
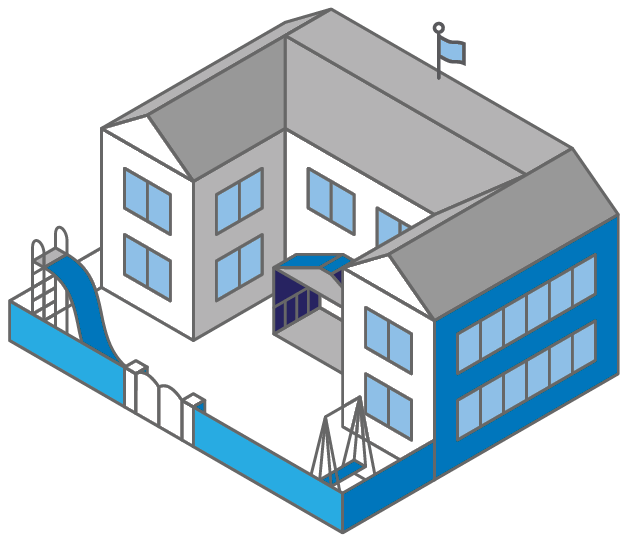
Testing at Schools and Childcare facilities
We are committed to working with our educational partners to keep lead out of drinking water at schools and childcare facilities in Philadelphia.
We’ve always supported testing for lead plumbing at public schools. Now, we’re also offering free testing for all schools and childcare facilities, including daycares, charter schools, and private schools.
Learn more: Drinking Water Sampling for Schools & Childcares
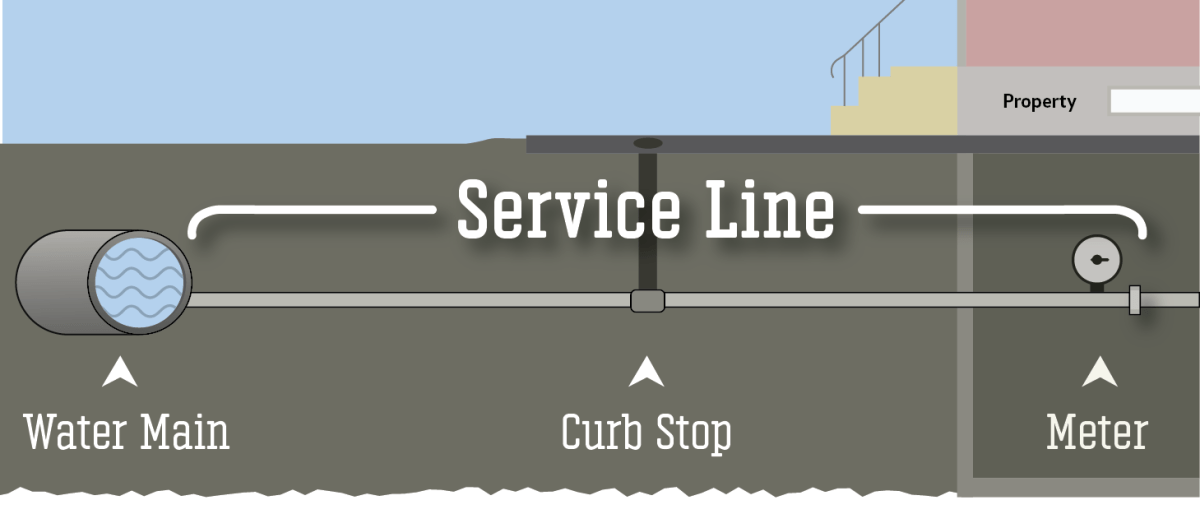
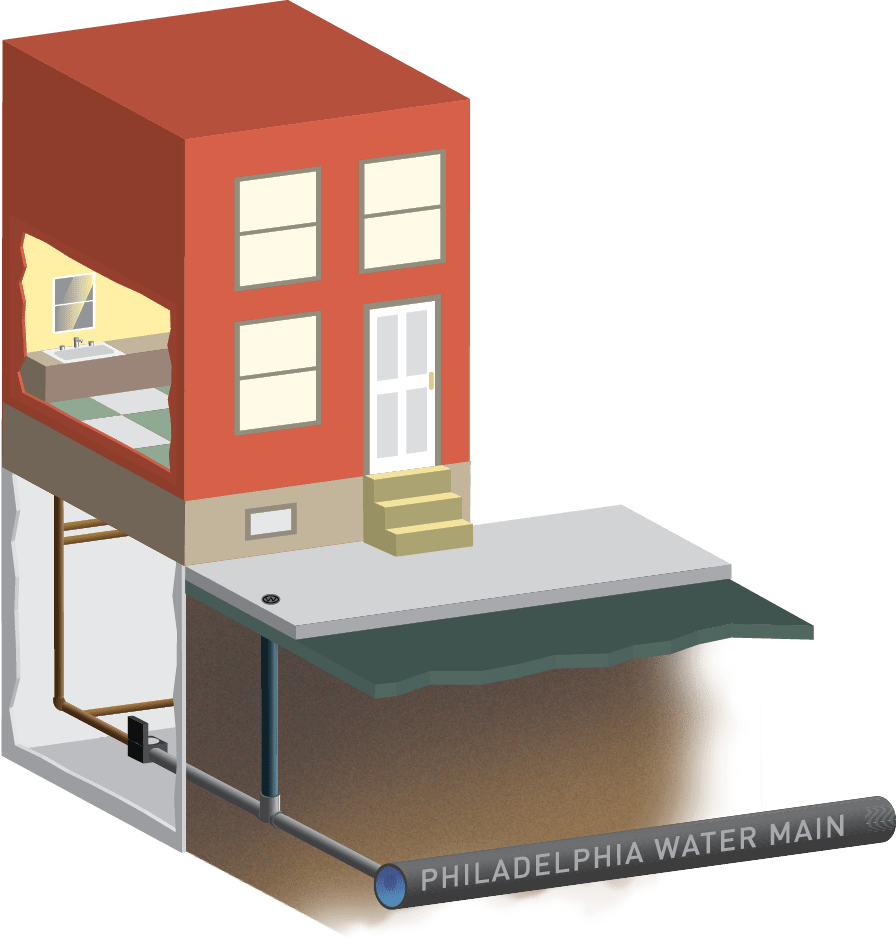
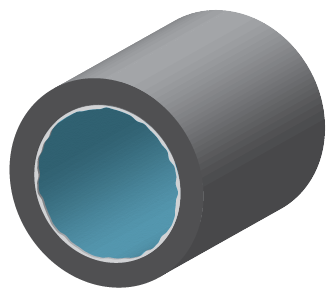
Meet your service line.
The service line is the pipe that carries clean water into your property from the city’s network of water mains. This pipe material can affect your water quality.
Pipe materials
Newer service lines are made of a non-lead material, like copper or plastic.
Older homes may have lead or galvanized metal in some part of their service line.
If your home has a pipe with lead or galvanized metal, follow the instructions below.
See more: Service Line Materials
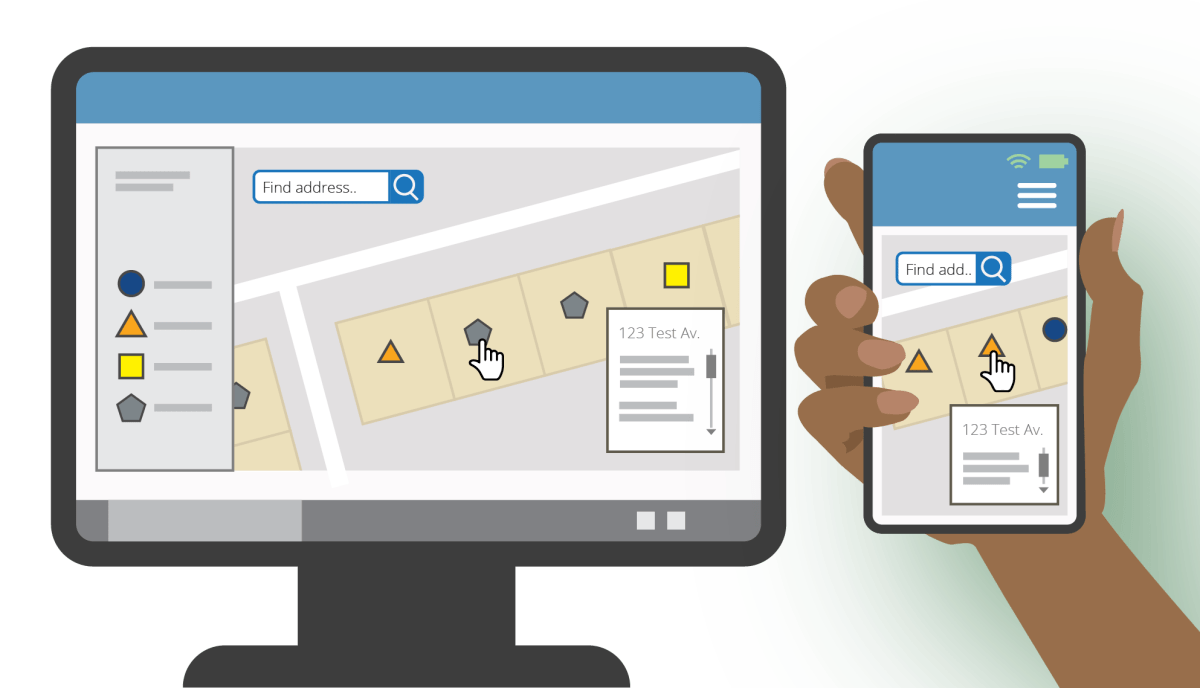
Service Line Material Map
Our online map shares any known records about the materials in your property’s service line. It also offers guidance, based on each property’s records.
You can view the map on your mobile device!
Incomplete records: Many service lines are categorized like this if we have partial or incomplete records for the service line. If your record is incomplete, the service line material is “lead status unknown,” but the material may still be lead. If you have a record of your service line material or believe our records are incorrect, report your service line material. We will update our records.
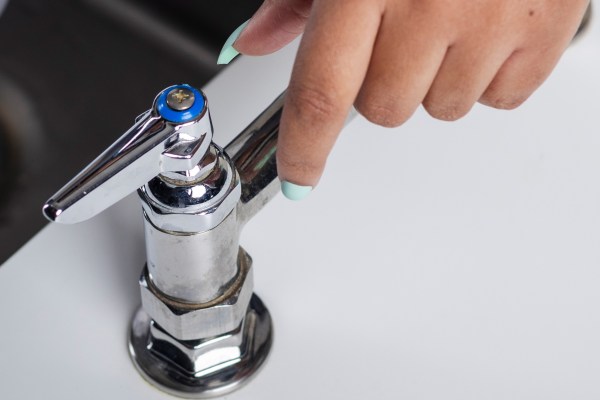
Flush your pipes.
Get rid of the water sitting in plumbing.
Run fast, cold water from a faucet for 3–5 minutes. This will flush out water that’s been sitting in your pipes.
When: If you haven’t used water for 6 hours or more—usually first thing in the morning when you wake up, and when you come home after work or school.
If your property has a lead service line: Flushing is important to do every day.
Cost: It costs pennies (or less) per day!
Fresh water starts at our water mains.
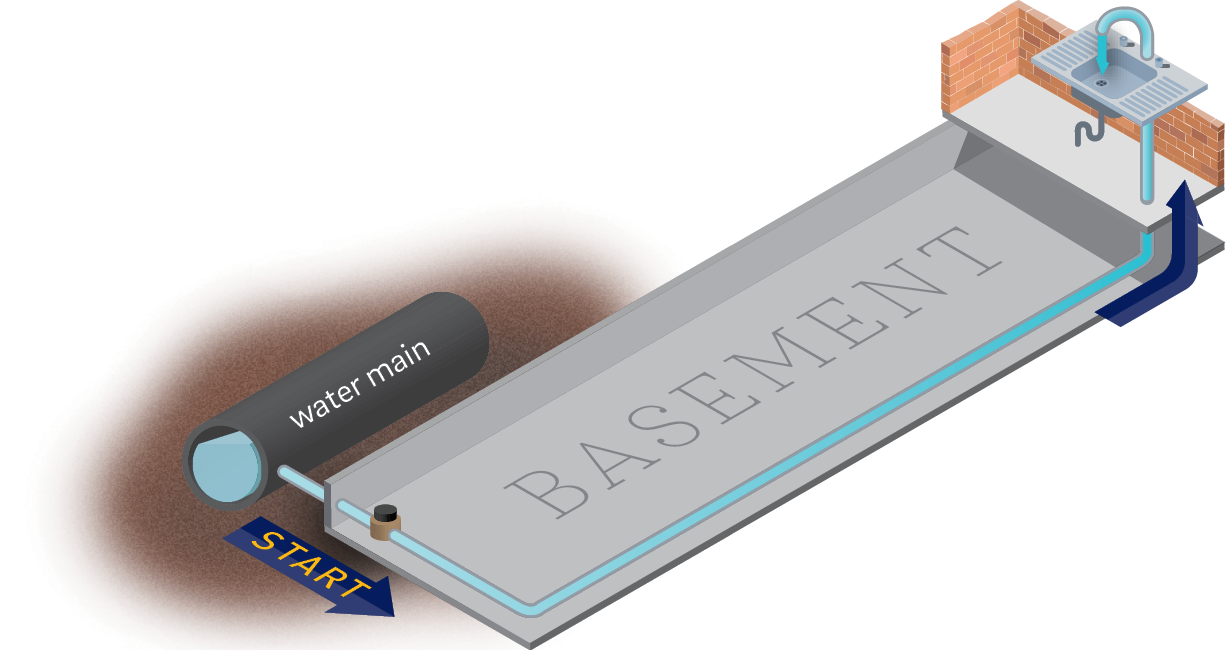
Running the tap gets rid of water sitting in pipes.
How flushing works
When you run your tap, it flushes away water that’s been sitting in your home’s plumbing and replaces it with fresh water from the water main. Run the tap until fresh water from the main comes through. Use longer times if your property is set back further from the street.
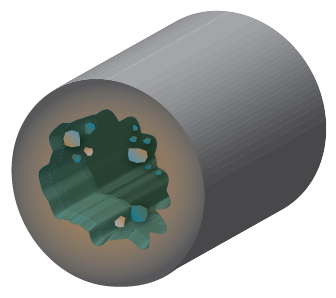
Potential sources of lead plumbing at home
If lead is found in water, the source is somewhere in a property’s plumbing.
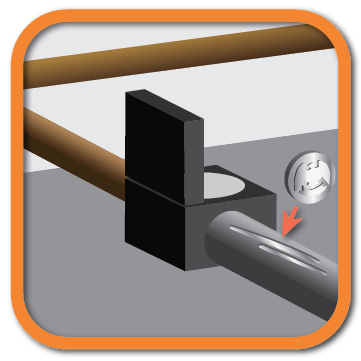
In part of a service line:
This is one of the first places to look for lead.
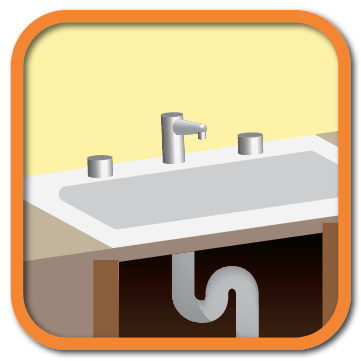
In a home’s older fixtures & valves:
Lead can also be in solder where pipes are joined.
Age matters:
Older fixtures and buildings are more likely to contain lead. Lead was used less after the 1950s, but fixtures and solder could still contain lead. Brass fixtures could contain lead until as late as 2014.
The good news? PWD’s treatment helps protect your water.
Zinc orthophosphate, added during treatment, forms a protective coating on the inside of pipes.
For over 30 years, Philadelphia has successfully used this process to reduce the amount of lead that can dissolve from plumbing into water.
Different building plumbing systems and usage patterns can affect how well corrosion control works.
We know it works because we test
Tests at homes with lead plumbing show our treatment is working: corrosion control keeps lead levels below state and federal limits.
Replacing a lead or galvanized service line
Whether or not to replace a service line depends on the property owner. If you aren’t able to replace a line, our treatment, plus flushing, will still keep your water safe. If you are considering replacement, here is information that can help.
Replacement options
The Homeowner Emergency Loan Program (HELP) offers zero-interest loans to replace lead or galvanized service lines. Customers have 5 years to pay off the loan.
Learn more: HELP Loans
There are other options for replacing a lead or galvanized service line, including hiring a private plumber.
Read more: Replacement options

We’re piloting other programs
We’re currently planning other ways for customers to replace service lines made of lead or galvanized metal.
If PWD offers to replace your line, take advantage and sign the permission form!
Testing new ways to verify service line material
We’re exploring technology that can check the material of the buried lines in less disruptive ways.
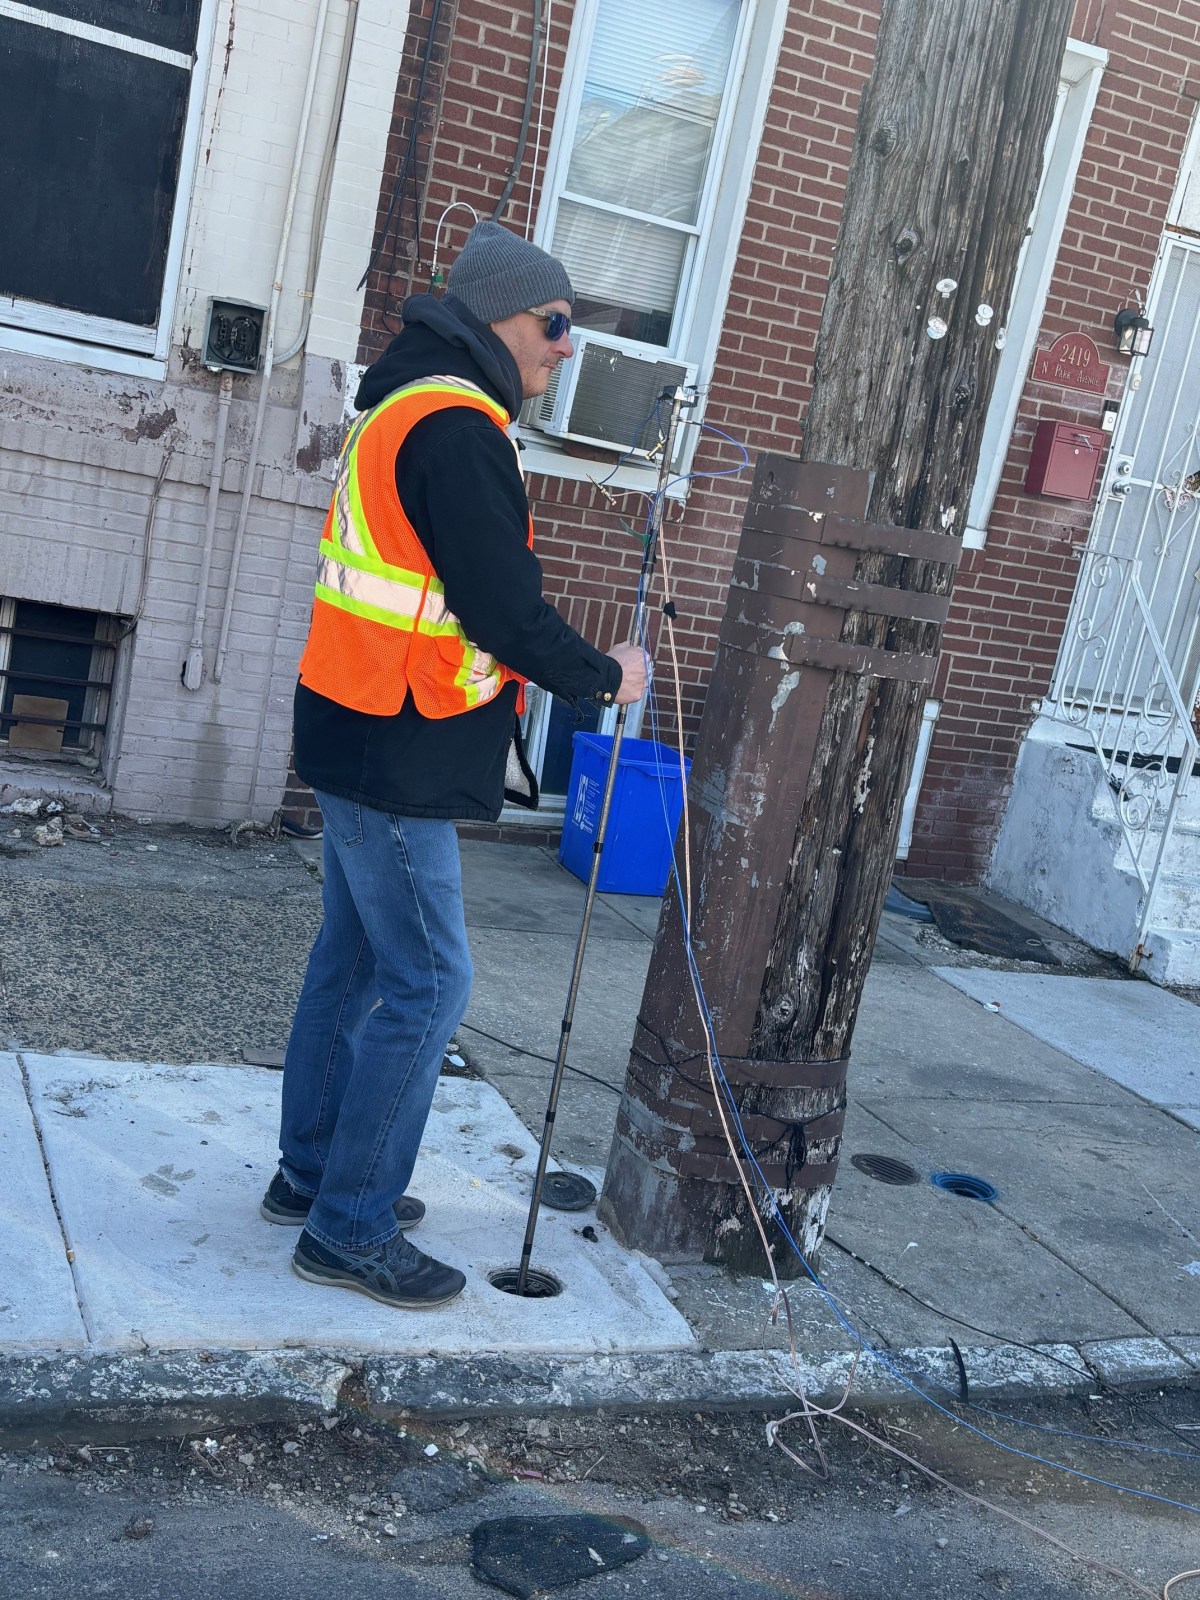
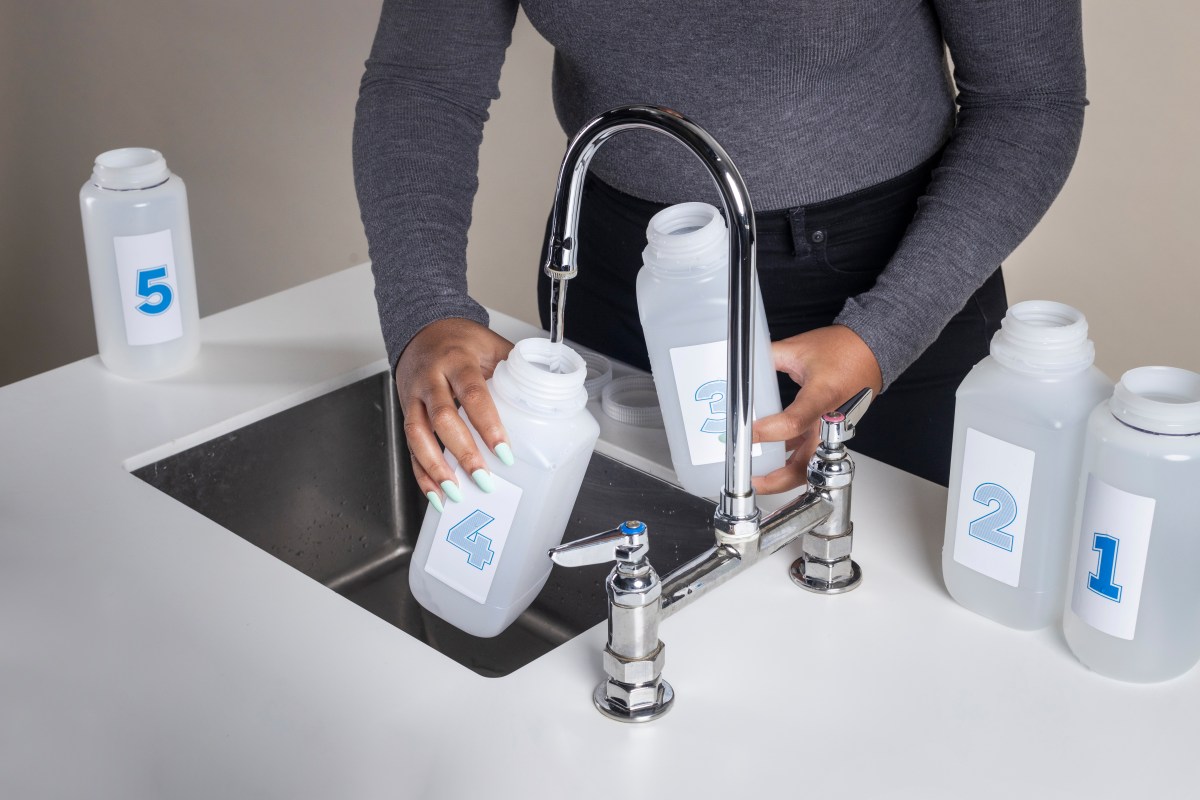
Testing drinking water in homes for lead
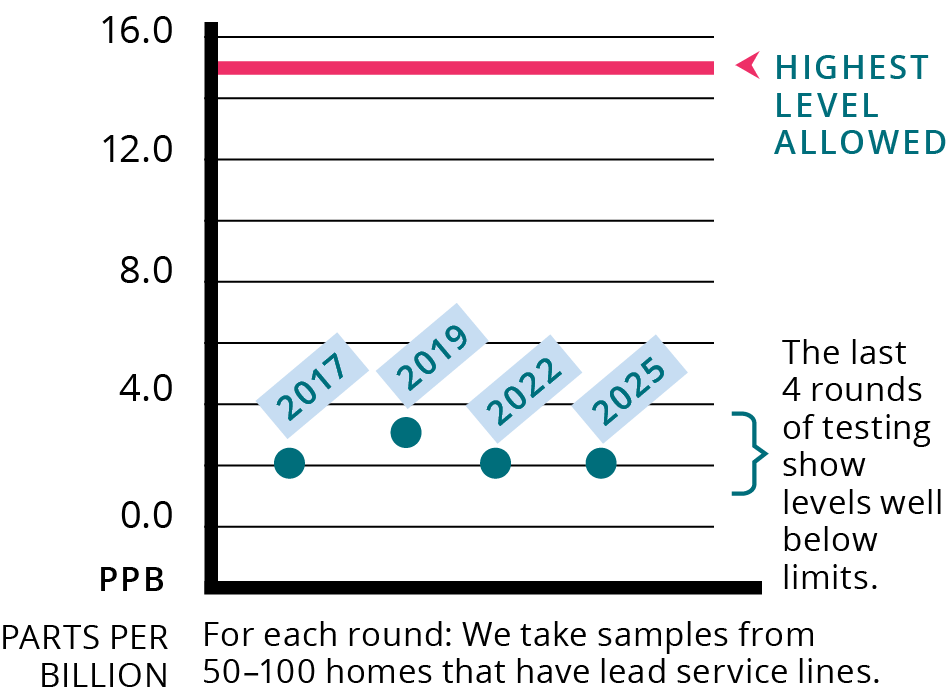
Every three years, we collect water samples from homes that have lead service lines. This is required by EPA’s Lead and Copper Rule. This rule requires that 90% of water samples have lead levels less than 15 parts per billion (ppb).
Our test results are consistently below this limit.
Top customer question:
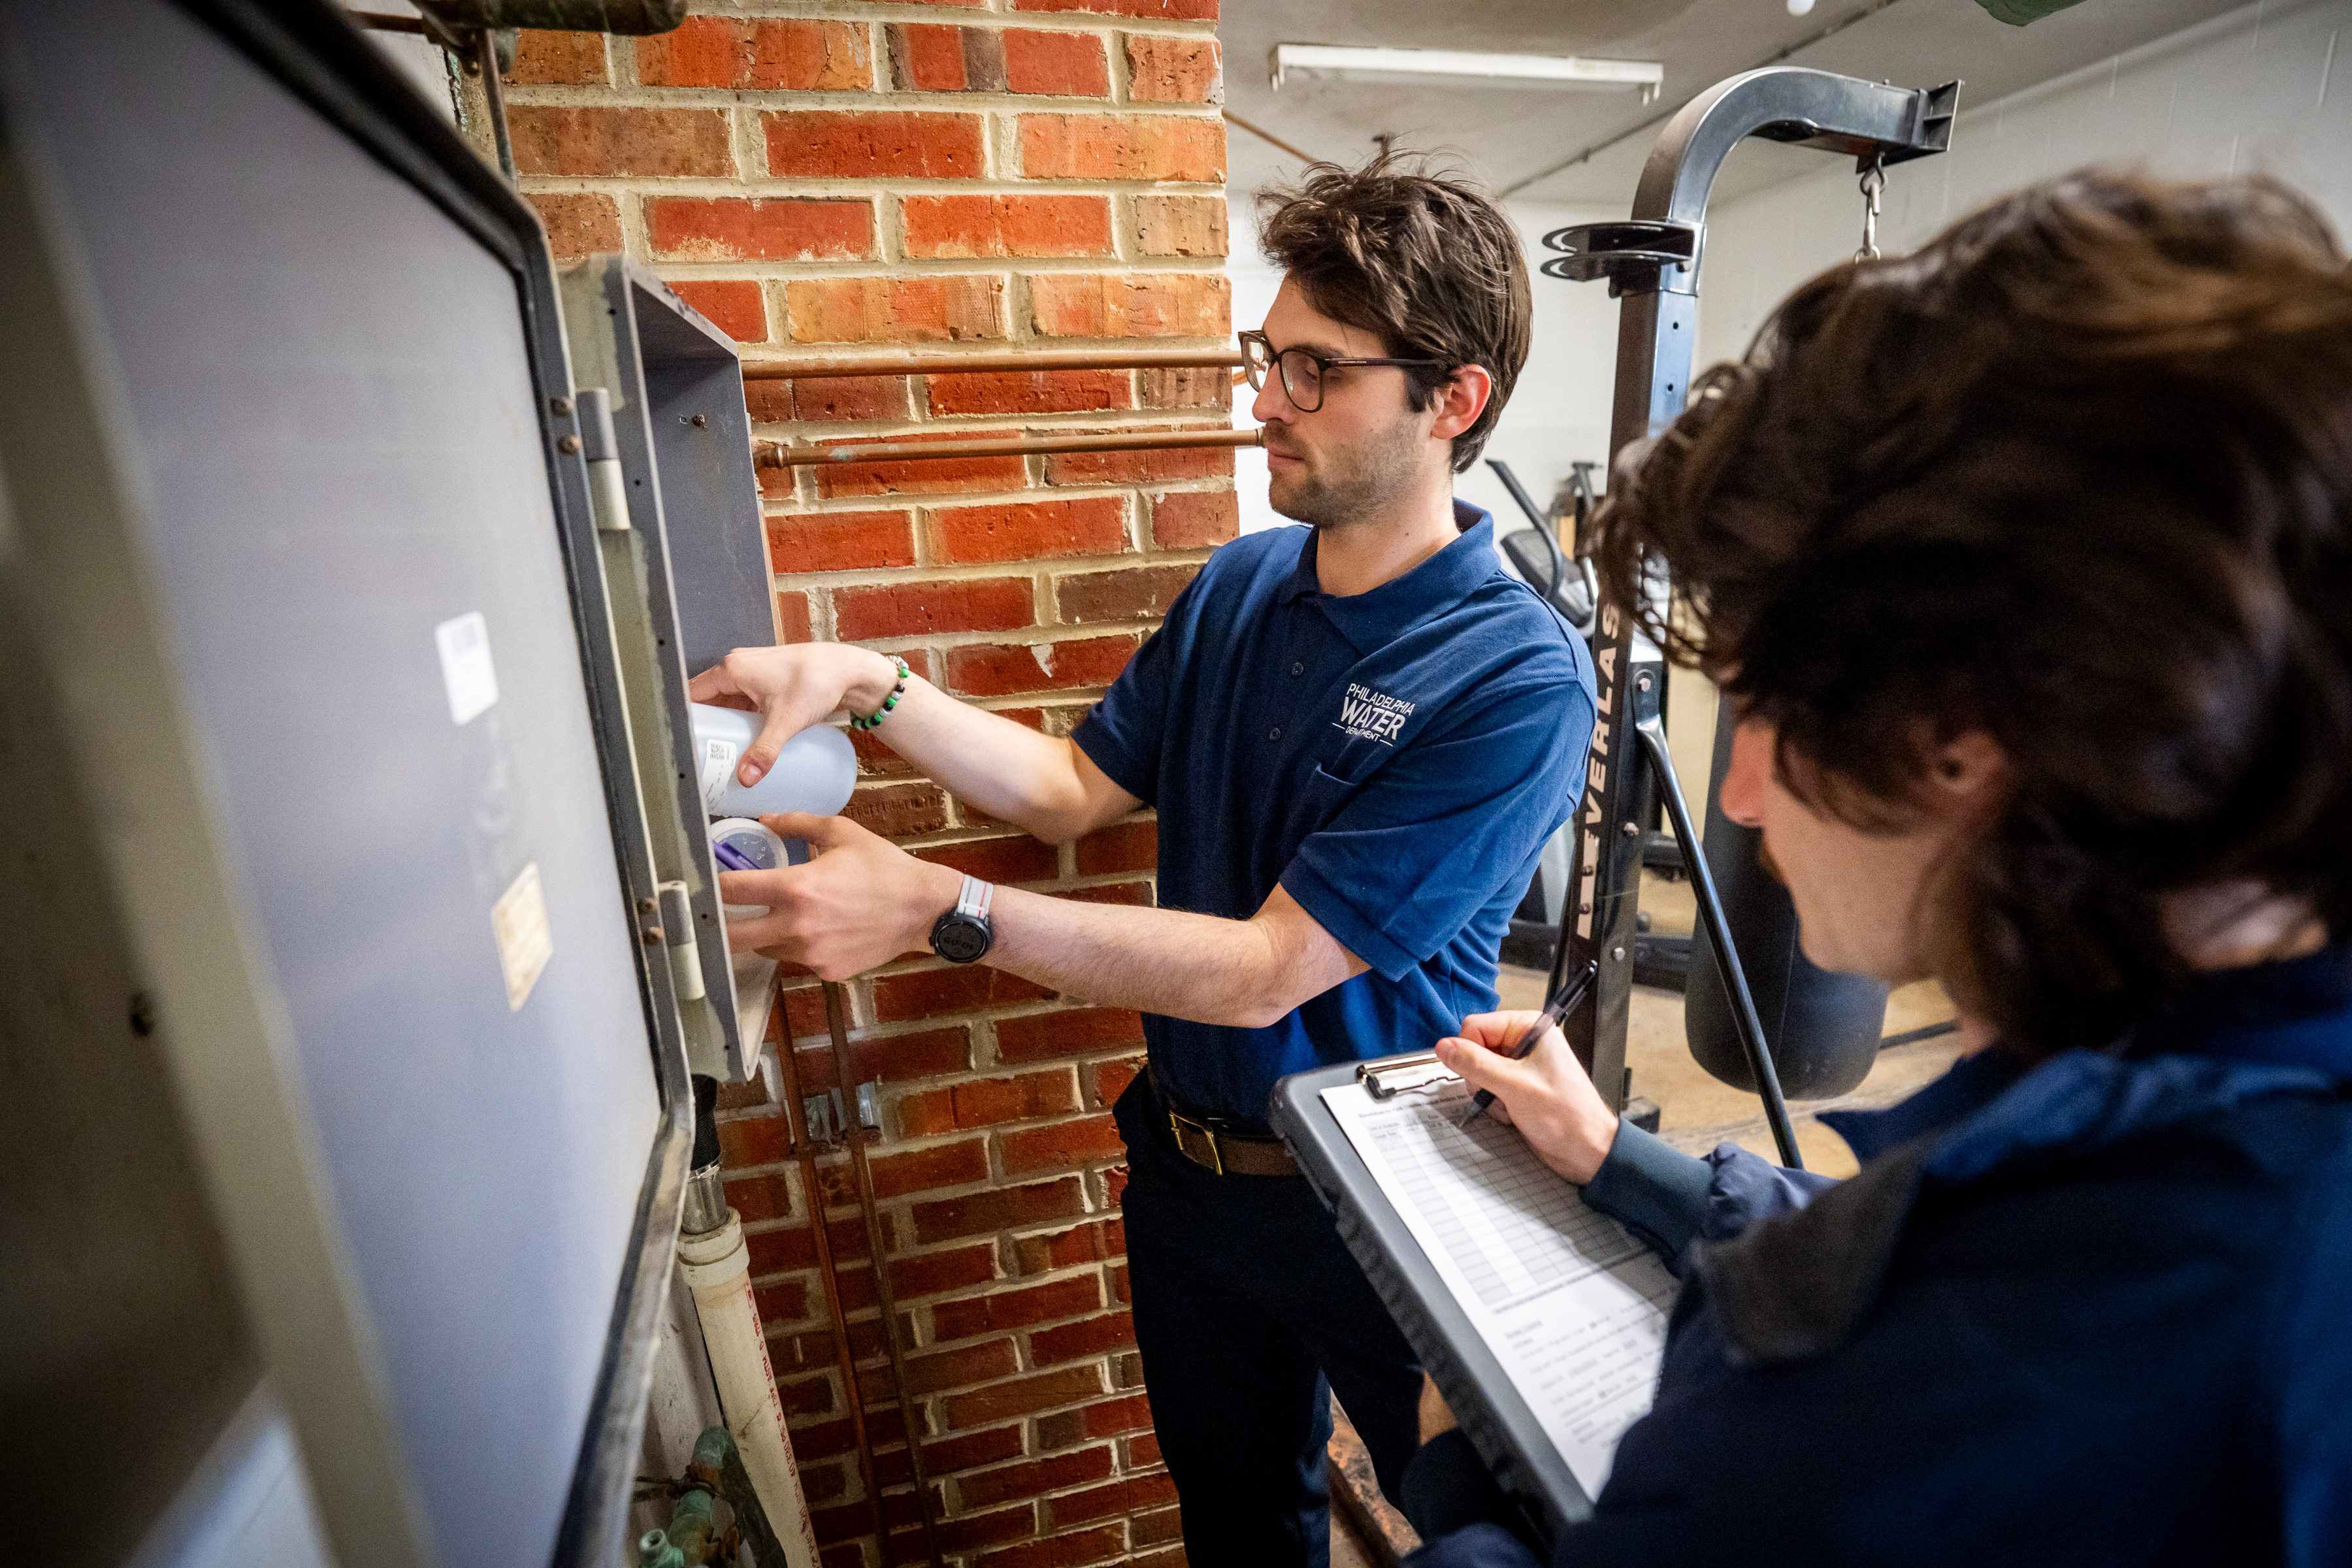
Will PWD test my water for lead?
Yes! We conduct free water tests for customers with concerns about lead plumbing in their home.
Request a test to get started.
Requests are processed as they are received. We are currently experiencing an increase in requests. We appreciate your patience!
A closer look Regulatory lead testing
Tested at customer homes with confirmed lead service lines.
Most recent results:
How we use the results
We use the results from our tests to optimize our corrosion control process on a regular basis.
Bottom line
Results show our corrosion control process is effectively reducing the risk of lead plumbing.
5 | 2025 Data tables & more
Introducing the results
All of PWD’s results are better than the required federal levels designed to protect public health.
This data shows how our processes keep your drinking water safe.
By reporting the results in these tables, we are meeting a requirement of the EPA.
We test for contaminants that could pose health risks to people with special health concerns. Our water meets or exceeds requirements for each of these regulated contaminants.
Measuring results
Many of these results are reported as “parts per million (ppm)” or “parts per billion (ppb)”.
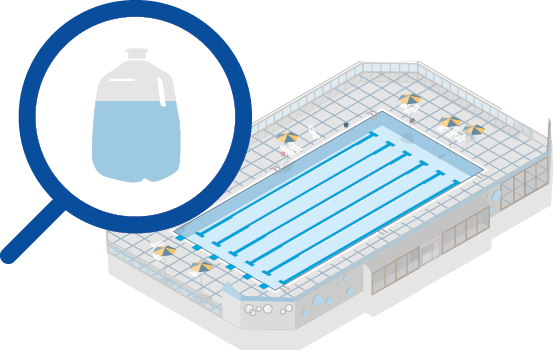
Parts per million (ppm)
Denotes 1 part per 1,000,000 parts, which is equivalent to two‑thirds of a gallon in an Olympic‑sized swimming pool.
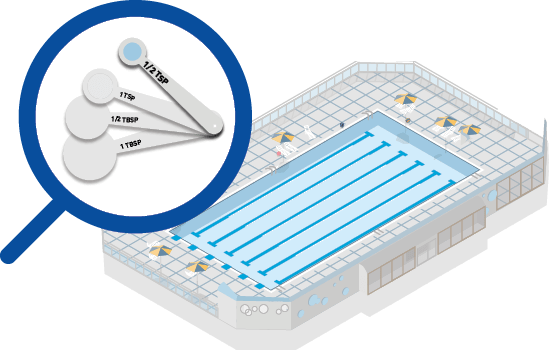
Parts per billion (ppb)
Denotes 1 part per 1,000,000,000 parts, which is equivalent to half a teaspoon in an Olympic‑sized swimming pool.
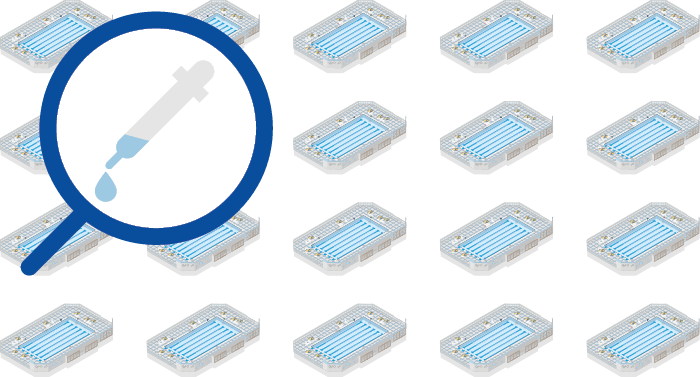
Parts per trillion (ppt)
Denotes 1 part per 1,000,000,000,000 parts, which is equivalent to one drop in 20 Olympic‑sized swimming pools.
Glossary
Here are definitions for some words and phrases we use in the report and in our data tables.
- Action Level: The concentration of a contaminant which, if exceeded, triggers treatment or other requirements that a water system must follow. The action level is not based on one sample; instead, it is based on many samples.
- Alkalinity: A measure of the water’s ability to resist changes in the pH level and a good indicator of overall water quality. Although there is no health risk from alkalinity, we monitor it to check our treatment processes.
- E. coli (Escherichia coli): A type of coliform bacteria that is associated with human and animal fecal waste.
- gpg (grains per gallon): A unit of water hardness. One grain per gallon is equal to 17.1 parts per million.
- Level 1 Assessment: A study of the water system to identify potential problems and determine (if possible) why total coliform bacteria have been found in our water system.
- Level 2 Assessment: A very detailed study of the water system to identify potential problems and determine (if possible) why an E. coli MCL violation has occurred and/or why total coliform bacteria have been found in our water system on multiple occasions.
- Locational Running Annual Average (LRAA): We calculate the average of samples taken from each location every quarter (3 months), and then the average of the last four quarterly averages to get the LRAA.
- MCL (Maximum Contaminant Level): The highest level of a contaminant that is allowed in drinking water. MCLs are set as close to the MCLGs as feasible using the best available treatment technology.
- MCLG (Maximum Contaminant Level Goal): The level of a contaminant in drinking water below which there is no known or expected risk to health. MCLGs allow for a margin of safety.
- MRDL (Maximum Residual Disinfection Level): The highest level of disinfectant that is allowed in drinking water. The addition of a disinfectant is necessary for the control of microbial contaminants.
- MRDLG (Maximum Residual Disinfection Level Goal): The level of a disinfectant in drinking water below which there is no known or expected risk to health. MRDLGs do not reflect the benefits of the use of disinfectants to control microbial contaminants.
- Minimum Residual Disinfection Level: The minimum level of residual disinfectant required at the entry point to the distribution system.
- NTU (nephelometric turbidity units): Turbidity is measured with an instrument called a nephelometer. Measurements are given in nephelometric turbidity units.
- Pathogens: Bacteria, virus, or other microorganisms that can cause disease.
- pCi/L (Picocuries per liter): A measure of radioactivity.
- PFAS: Human-made perfluoroalkyl and polyfluoroalkyl substances used in industrial applications and a wide range of consumer products. PFAS compounds are found around the world and are not solely in water.
- ppm (parts per million): Denotes 1 part per 1,000,000 parts, which is equivalent to two thirds of a gallon in an Olympic-sized swimming pool.
- ppb (parts per billion): Denotes 1 part per 1,000,000,000 parts, which is equivalent to half a teaspoon in an Olympic-sized swimming pool.
- μg/L (Microgram per liter): One microgram per liter is equal to one part per billion.
- ppt (parts per trillion): Denotes 1 part per 1,000,000,000,000 parts, which is equivalent to one drop in 20 Olympic-sized swimming pools.
- SMCL (Secondary Maximum Contaminant Level): Non-enforceable Federal water quality guidelines that are established for managing aesthetic and cosmetic conditions of water (e.g. taste, odor, color).
- SOC (Synthetic Organic Chemical): Commercially made organic compounds, such as pesticides and herbicides.
- Total Coliform: Coliforms are bacteria that are naturally present in the environment. Their presence in drinking water may indicate that other potentially harmful bacteria are also present.
- THAAs (Total Haloacetic Acids): A group of chemicals known as disinfection byproducts. These form when a disinfectant reacts with naturally occurring organic and inorganic matter in the water.
- TOC (Total Organic Carbon): A measure of the carbon content of organic matter. This measure is used to indicate the amount of organic material in the water that could potentially react with a disinfectant to form disinfection byproducts.
- TTHMs (Total Trihalomethanes): A group of chemicals known as disinfection byproducts. These form when a disinfectant reacts with naturally occurring organic and inorganic matter in the water.
- Treatment Technique: A required process intended to reduce the level of a contaminant in drinking water.
- Turbidity: A measure of the clarity of water related to its particle content. Turbidity serves as an indicator for the effectiveness of the water treatment process. Low turbidity measurements, such as ours, show the significant removal of particles that are much smaller than can be seen by the naked eye.
- VOC (Volatile Organic Chemicals): Organic chemicals that can be either man-made or naturally occurring. These include gases and volatile liquids.
- WTP: Water Treatment Plant
What we test for and how
Public drinking water systems monitor their treated drinking water for approximately 100 regulated contaminants. These regulatory parameters are defined within federal rules, such as the Revised Total Coliform Rule, Surface Water Treatment Rule, Disinfectants and Disinfection Byproducts Rules, Lead and Copper Rule, and the Radionuclides Rule.
We monitor for the regulated parameters listed below.
Any contaminants found are noted in the tables in the following section.
Inorganic Chemicals
- Antimony
- Arsenic
- Barium
- Beryllium
- Cadmium
- Chromium
- Copper
- Cyanide
- Fluoride
- Lead
- Mercury
- Nickel
- Nitrate
- Nitrite
- Selenium
- Thallium
Synthetic Organic Chemicals
- 2,3,7,8 – TCDD (Dioxin)
- 2,4 – D
- 2,4,5 – TP (Silvex)
- Alachlor
- Atrazine
- Benzopyrene
- Carbofuran
- Chlordane
- Dalapon
- Di(ethylhexyl) adipate
- Di(ethylhexyl) phthalate
- Dibromochloropropane
- Dinoseb
- Diquat
- Endothall
- Endrin
- Ethylene Dibromide
- Glyphosate
- Heptachlor
- Heptachlor epoxide
- Hexachlorobenzene
- Hexachlorocyclopentadiene
- Lindane
- Methoxychlor
- Oxamyl
- PCBs Total
- Pentachlorophenol
- Picloram
- Simazine
- Toxaphene
Volatile Organic Chemicals
- Benzene
- Carbon Tetrachloride
- 1,2-Dichloroethane
- o-Dichlorobenzene
- p-Dichlorobenzene
- 1,1-Dichloroethylene
- cis-1,2-Dichloroethylene
- trans-1,2-Dichloroethylene
- Dichloro-methane
- 1,2-Dichloropropane
- Ethylbenzene
- Monochlorobenzene
- Styrene
- Tetrachloroethylene
- Toluene
- 1,2,4-Trichlorobenzene
- 1,11-Trichloroethane
- 1,1,2-Trichloroethane
- Trichloro-ethylene
- o-Xylene
- m,p-Xylenes
- Vinyl Chloride
Radiological Contaminants
- Uranium
- Alpha Emitters
- Radium 226
- Radium 228
Perfluoroalkyl and Polyfluoroalkyl Substances
- PFOA
- PFOS
- PFNA
- PFBS
- PFHxS
- HFPO-DA (GenX)
Other factors that can impact drinking water

Appealing to Your Senses
We work to ensure your water looks, tastes and smells the way it should.

To meet all water quality taste and odor guidelines, we test for the following: alkalinity, aluminum, chloride, color, hardness, iron, manganese, odor, pH, silver, sodium, sulfate, total dissolved solids, turbidity, and zinc.
Temperature and Cloudiness
The temperature of the Schuylkill and Delaware Rivers varied seasonally in 2025 from approximately 32°–95° Fahrenheit. PWD does not treat the water for temperature.

Cloudiness in tap water most commonly happens in the winter, when the cold water from the water main is warmed up quickly in household plumbing. Cold water and water under pressure can hold more air than warmer water and water open to the atmosphere.
When cold winter water comes out of your tap, it’s simultaneously warming up and being relieved of the pressure it was under inside the water main and in your plumbing. The milky white color is actually just tiny air bubbles. If you allow the glass to sit undisturbed for a few minutes, you will see it clear up gradually.
2025 Data tables
Detected Regulated Contaminants
Lead & Copper
Tested at Customers’ taps. Testing is done every 3 years. Most recent tests were done in 2025.
| EPA’s Action Level: For a Representative Sampling of Customer Homes | Ideal Goal (EPA’s MCLG) | 90% of PWD Customers’ Homes Were Less Than or Equal to | Number of Homes Considered to Have Elevated Levels | Range of Tap Sampling Results | Violation | Source | |
|---|---|---|---|---|---|---|---|
| Lead | 90% of homes must test less than 15 ppb | 0 ppb | 2.0 ppb | 1 out of 106 | 0–21 ppb | No | Corrosion of household plumbing; Erosion of natural deposits |
| Copper | 90% of homes must test less than 1.3 ppm | 1.3 ppm | 0.210 ppm | 0 out of 106 | 0.000–0.464 ppm | No | Corrosion of household plumbing; Erosion of natural deposits; Leaching from wood preservatives |
When lead is found in drinking water, it comes from plumbing. Lead can cause serious health problems, especially for pregnant women and young children. Lead in drinking water is primarily from materials and components associated with service lines and home plumbing. PWD is responsible for providing high-quality drinking water and removing lead pipes, but cannot control the variety of materials used in plumbing components in your home. You share the responsibility for protecting yourself and your family from the lead in your home plumbing. You can take responsibility by identifying and removing lead materials within your home plumbing and taking steps to reduce your family’s risk. Before drinking tap water, flush your pipes for several minutes by running your tap, taking a shower, doing laundry, or washing a load of dishes. You can also use a filter certified by an American National Standards Institute-accredited certifier to reduce lead in drinking water. If you are concerned about lead in your water and wish to have your water tested, request a test.
Information on lead in drinking water, testing methods, and steps you can take to minimize exposure is available from the EPA. Learn more about Lead Plumbing & Water Quality →
Inorganic Chemicals (IOC)
PWD monitors for IOC more often than required by EPA.
| Chemical | Highest Level Allowed (EPA’s MCL) | Ideal Goal (EPA’s MCLG) | Highest result | Range of Test Results for the Year | Violation | Source |
|---|---|---|---|---|---|---|
| Antimony | 0.006 ppm | 0.006 ppm | 0.0007 ppm | 0–0.0007 ppm | No | Discharge from petroleum refineries; Fire retardants; Ceramics; Electronics; Solder |
| Barium | 2 ppm | 2 ppm | 0.043 ppm | 0.024–0.043 ppm | No | Discharges of drilling wastes; Discharge from metal refineries; Erosion of natural deposits |
| Chromium | 100 ppb | 100 ppb | 2 ppb | 0–2 ppb | No | Discharge from steel and pulp mills; Erosion of natural deposits |
| Fluoride | 2 ppm* | 2 ppm* | 0.75 ppm | 0.68–0.75 ppm | No | Erosion of natural deposits; Water additive which promotes strong teeth; Discharge from fertilizer and aluminum factories |
| Nitrate^ | 10 ppm | 10 ppm | 5.3 ppm | 0.509–5.3 ppm | No | Runoff from fertilizer use; Leaching from septic tanks; Erosion of natural deposits |
- * EPA’s MCL and MCLG is 4.0 ppm, but PA DEP has set this lower MCL and MCLG which takes precedence.
- ^ Nitrate in drinking water at levels above 10 ppm is a health risk for infants of less than six months of age. High nitrate levels in drinking water can cause blue baby syndrome. Nitrate levels may rise quickly for short periods of time because of rainfall or agricultural activity. If you are caring for an infant, you should ask for advice from your health care provider.
PWD also monitored for Arsenic, Beryllium, Cadmium, Cyanide, Mercury, Nitrite, Selenium, and Thallium in 2025; all results were below respective parameter detection limits.
Radiological Contaminants
Most recent tests were done in 2023.
| Highest Level Allowed (EPA’s MCL) | Ideal Goal (EPA’s MCLG) | Highest result | Range of Test Results for the Year | Violation | Source | |
|---|---|---|---|---|---|---|
| Alpha Emitters | 15 pCi/L | 0 pCi/L | 5.32 pCi/L | 0–5.32 pCi/L | No | Erosion of natural deposits |
Total Chlorine Residual
Continuously monitored at Water Treatment Plants
| Sample Location | Minimum Disinfectant Residual Level Allowed | Lowest Level Detected | Yearly Range | Violation | Source |
|---|---|---|---|---|---|
| Baxter WTP | 0.20 ppm | 2.35 ppm | 2.35–3.51 ppm | No | Water additive used to control microbes |
| Belmont WTP | 0.20 ppm | 1.77 ppm | 1.77–2.82 ppm | No | Water additive used to control microbes |
| Queen Lane WTP | 0.20 ppm | 2.00 ppm | 2.00–3.90 ppm | No | Water additive used to control microbes |
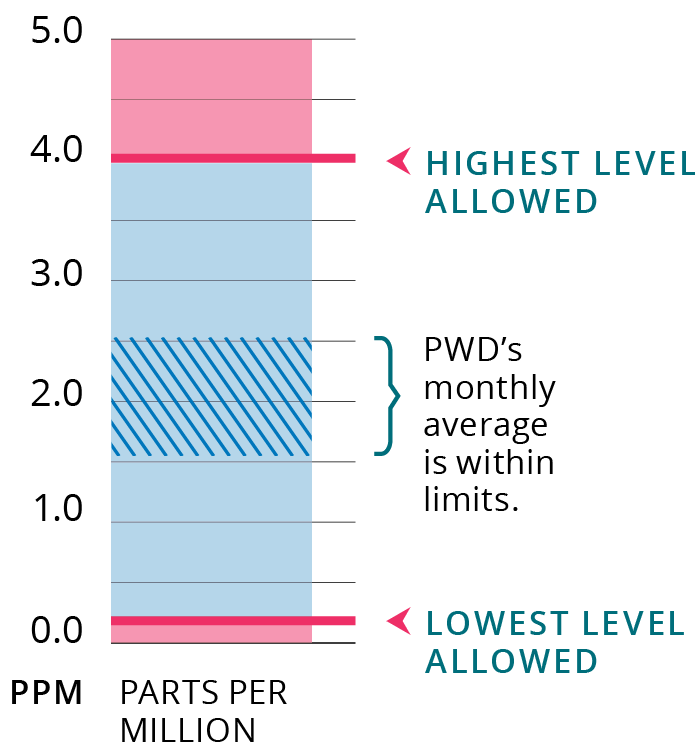
Total Chlorine Residual
Tested throughout the Distribution System. Over 360 samples collected throughout the City every month.
| Sample Location | Maximum Disinfectant Residual Allowed | Highest Monthly Average | Monthly Average Range | Violation | Source |
|---|---|---|---|---|---|
| Distribution System | 4.0 ppm | 2.54 ppm | 1.54–2.54 ppm | No | Water additive used to control microbes |
Secondary Chemicals
| Chemical | EPA’s SMCL | Baxter WTP One Year Range* | Belmont WTP One Year Range* | Queen Lane WTP One Year Range* | Violation* | Source |
|---|---|---|---|---|---|---|
| Chloride | 250 ppm | 53–142 ppm | 67–300 ppm | 76–397 ppm | No | Main component of many salts, may increase in winter months; Erosion of natural minerals; Used in the water treatment process in the form of ferric chloride. |
| Copper | 1.0 ppm | 0.032–0.058 ppm | 0.007–0.036 ppm | 0.023–0.038 ppm | No | Corrosion of copper pipes in premise plumbing; Erosion of natural deposits. |
| Fluoride | 2.0 ppm^ | 0.71 ppm | 0.75 ppm | 0.68 ppm | No | Erosion of natural deposits; Water additive that promotes strong teeth; Discharge from fertilizer and aluminum factories. |
| Iron | 0.3 ppm | 0 ppm | 0–0.016 ppm | 0–0.017 ppm | No | Corrosion of iron water mains and premise plumbing; Erosion of natural minerals; Used in the water treatment process in the form of ferric chloride. |
| pH | 6.5-8.5 | 7.03–7.25 | 7.09–7.34 | 7.12–7.31 | No | Adjusted during the water treatment process. |
| Sulfate | 250 ppm | 6.74–16.7 ppm | 17.90–61.80 ppm | 18.50–54.20 ppm | No | Erosion of natural minerals; Runoff from mining operations. |
| Total Dissolved Solids | 500 ppm | 134–336 ppm | 292–582 ppm | 262–808 ppm | No | Erosion of natural minerals; May increase during winter months due to road salt runoff or during drought conditions. |
PWD also monitored for Aluminum, Color, Manganese, and Silver in 2025; all results were below respective parameter detection limits.
- * Individual results are averaged monthly and compliance is based on running annual average.
- ^ EPA’s MCL and MCLG is 4.0 ppm, but PA DEP has set this lower MCL and MCLG which takes precedence.
Bacteria in Tap Water
Tested throughout the Distribution System. Over 400 samples collected throughout the City each month.
| Highest Level Allowed (EPA’s MCL) | Ideal Goal (EPA’s MCLG) | Highest Monthly % or Yearly Total of Positive Samples | Monthly Range (% of Samples) | Violation | Source | |
|---|---|---|---|---|---|---|
| Total Coliform | No more than 5% of samples can test positive in a single month* | 0 | 0.30% | 0%–0.3% | No | Naturally present in the environment |
| E. coli | 0 | 0.30% | 0%–0.3% | No | Human or animal fecal waste. |
- * Every sample that is positive for total coliforms must also be analyzed for E. coli. If a system has two consecutive total coliform positive samples, and one is also positive for E. coli, then the system has an MCL violation. There were no Level 1 or Level 2 assessments required under the Revised Total Coliform Rule in 2025.
Total Organic Carbon
Tested at Water Treatment Plants
| Treatment Technique Requirement | Baxter WTP One Year Average | Belmont WTP One Year Average | Queen Lane WTP One Year Average | Violation | Source |
|---|---|---|---|---|---|
| Percent of Removal Required | 25–45% | 25–45% | 25–35% | N/A | Naturally present in the environment |
| Percent of Removal Achieved* | 46–69% | 23–63% | 36–72% | No | Naturally present in the environment |
| Number of Quarters out of Compliance* | 0 | 0 | 0 | No | Naturally present in the environment |
- * PWD achieved TOC removal requirements in all quarters of 2025 at all WTPs. Compliance is based on a running annual average computed quarterly. The numbers shown represent a range of TOC results in weekly samples.
Turbidity
A measure of clarity. Tested at water treatment plants.
| Baxter WTP | Belmont WTP | Queen Lane WTP | Violation | Source | |
|---|---|---|---|---|---|
| Treatment Technique Requirement: 95% of samples must be at or below 0.300 NTU | 100% below 0.300 NTU | 100% below 0.300 NTU | 100% below 0.300 NTU | No | Soil runoff, river sediment |
| Highest single value for the year | 0.107 NTU | 0.205 NTU | 0.091 NTU | No | Soil runoff, river sediment |
We are required to monitor your drinking water for specific contaminants on a regular basis. The results of this monitoring indicate whether or not your drinking water meets health standards. PWD continuously operates and monitors water quality from a total of 160 filters at three drinking water treatment plants. On March 5, 2026, continuous on-line turbidity monitoring was interrupted on one of our filters. On March 7, 2026, Filter #10 at the Queen Lane Plant was found in service without turbidity monitoring for a period of 50.3 hours. The monitoring interruption was a result of an internal sensor error due to excess moisture inside the sensor, creating an artificial steady turbidity reading, until operators recognized the data trend was not responding on March 7, 2026. During this single filter monitoring interruption, the combined flow from the plant filters at the Queen Lane Plant was continuously sampled and monitored with no change in turbidity levels. The sensor issue was addressed, and additional checks have been put in place to ensure it does not occur again. No water quality emergency occurred due to the monitoring interruption, and this notice is for informational purposes only.
Disinfection By-Products
| Highest Level Allowed (EPA’s MCL) – Running Annual Average | Running Annual Average 2025* | System-wide Range of Results | Violation | Source | |
|---|---|---|---|---|---|
| Total Trihalomethanes (TTHM) | 80 ppb | 51 ppb | 18–90 ppb | No | By-product of drinking water disinfection |
| 5 Haloacetic Acids (HAA5) | 60 ppb | 41 ppb | 2–86 ppb | No | By-product of drinking water disinfection |
- * Monitoring is conducted at 16 locations throughout the City of Philadelphia.
This result is the highest locational running annual average in 2025.
PFAS
System-wide range of results
| Chemical | Highest Level Allowed (MCL) | Ideal Goal (MCLG) | Highest Result | System Wide Range of Results* | Violation^ | Source | ||
|---|---|---|---|---|---|---|---|---|
| EPA† | PA DEP | EPA† | PA DEP | |||||
| PFOA | 4 ppt | 14 ppt | 0 ppt | 8 ppt | 6.1 ppt | 2.6–6.1 ppt | No | Discharge from manufacturing facilities and runoff from land use activities. |
| PFOS | 4 ppt | 18 ppt | 0 ppt | 14 ppt | 4.6 ppt | 1.6–4.6 ppt | No | Discharge from manufacturing facilities and runoff from land use activities. |
| PFNA | 10 ppt | N/A | 10 ppt | N/A | 2.6 ppt | 0–2.6 ppt | No | Discharge from manufacturing facilities and runoff from land use activities. |
| PFBS‡ | Hazard Index | N/A | Hazard Index | N/A | 6.1 ppt | 1.7–6.1 ppt | No | Discharge from manufacturing facilities and runoff from land use activities. |
| PFHxS | 10 ppt | N/A | 10 ppt | N/A | 1.7 ppt | 0–1.7 ppt | No | Discharge from manufacturing facilities and runoff from land use activities. |
| (HFPO-DA)/GenX | 10 ppt | N/A | 10 ppt | N/A | 0 ppt | 0 ppt | No | Discharge from manufacturing facilities and runoff from land use activities. |
- * Samples were collected on 1/22/2025, 4/14/2025, 7/14/2025, 10/6/2025
- ^ Compliance for 2025 was based on Running Annual Averages at each Water Treatment Plant compared to Pennsylvania Department of Environmental Protection’s (PA DEP) MCLs.
- † Compliance with EPA MCL monitoring begins in 2027. Meeting MCLs is required beginning in 2029.
- ‡ PFBS does not have an individual MCL but is included in Hazard Index calculation
For more information, please see PFAS Management.
Unregulated Contaminant Monitoring (UCMR)
| Chemical | Testing Period | Average | Range |
|---|---|---|---|
| PFOA | 1/8/2024–10/7/2024 | 4.6 ppt | 0–8.1 ppt |
| PFOS | 1/8/2024–10/7/2024 | 3.6 ppt | 0–6.0 ppt |
| PFHxA | 1/8/2024–10/7/2024 | 5 ppt | 0–9.1 ppt |
| PFPeA | 1/8/2024–10/7/2024 | 4.9 ppt | 0–9.9 ppt |
| PFBS | 1/8/2024–10/7/2024 | 3.6 ppt | 0–10.0 ppt |
| PFBA | 1/8/2024–10/7/2024 | 2.3 ppt | 0–7.6 ppt |
| PFNA | 1/8/2024–10/7/2024 | 0.8 ppt | 0–4.5 ppt |
| PFHpA | 1/8/2024–10/7/2024 | 1 ppt | 0–3.3 ppt |
In 2024, PWD performed special monitoring as part of the Unregulated Contaminant Monitoring Rule (UCMR), a nationwide monitoring effort conducted by the EPA. Unregulated contaminants are those that do not yet have a drinking water standard set by the EPA. The purpose of monitoring for these contaminants is to help the EPA decide whether the contaminants should have a standard. For more information concerning UCMR, visit these websites: EPA: Fifth Unregulated Contaminant Monitoring Rule or Unregulated Contaminant Monitoring Rule on DrinkTap.org.
Unregulated contaminants not detected at any of the sampling locations
11-chloroeicosafluoro-3-oxaundecane-1-sulfonic acid (11Cl-PF3OUdS), 1H,1H,2H,2H-perfluorodecane sulfonic acid (8:2FTS), 1H,1H,2H,2H-perfluorohexane sulfonic acid (4:2FTS), 1H,1H,2H,2H-perfluorooctane sulfonic acid (6:2FTS), 4,8-dioxa-3H-perfluorononanoic acid (ADONA), 9-chlorohexadecafluoro-3-oxanonane-1-sulfonic acid (9Cl-PF3ONS), hexafluoropropylene oxide dimer acid (HFPO-DA)(GenX), nonafluoro-3,6-dioxaheptanoic acid (NFDHA), perfluoro (2-ethoxyethane) sulfonic acid (PFEESA), perfluoro-3-methoxypropanoic acid (PFMPA), perfluoro-4-methoxybutanoic acid (PFMBA), perfluorodecanoic acid (PFDA), perfluorododecanoic acid (PFDoA), perfluoroheptanesulfonic acid (PFHpS), perfluorohexanesulfonic acid (PFHxS), perfluoropentanesulfonic acid (PFPeS), perfluoroundecanoic acid (PFUnA),N-ethyl perfluorooctanesulfonamidoacetic acid (NEtFOSAA), N-methyl perfluorooctanesulfonamidoacetic acid (NMeFOSAA), perfluorotetradecanoic acid (PFTA), perfluorotridecanoic acid (PFTrDA), Lithium
Sodium, Hardness, and Alkalinity in tap water
The parameters listed below are not part of EPA’s requirements and are provided for information purposes.
Sodium in Tap Water
| Baxter WTP One Year Average | Belmont WTP One Year Average | Queen Lane WTP One Year Average | |
|---|---|---|---|
| Average (ppm) | 28 ppm | 55 ppm | 49 ppm |
| Average (mg in 8 oz. glass of water) | 7 mg | 13 mg | 12 mg |
| Range (ppm) | 16–63 ppm | 32–145 ppm | 28–188 ppm |
| Range (mg in 8 oz. glass of water) | 4–15 mg | 7–34 mg | 7–44 mg |
Hardness in Tap Water
| Baxter WTP One Year Average | Belmont WTP One Year Average | Queen Lane WTP One Year Average | |
|---|---|---|---|
| Average | 101 ppm or 6 gpg | 151 ppm or 9 gpg | 169 ppm or 10 gpg |
| Minimum | 72 ppm or 4 gpg | 99 ppm or 6 gpg | 119 ppm or 7 gpg |
| Maximum | 121 ppm or 7 gpg | 204 ppm or 12 gpg | 270 ppm or 16 gpg |
Hardness defines the quantity of minerals, such as calcium and magnesium, in water. These minerals react with soap to form insoluble precipitates and can affect common household chores such as cooking and washing. Philadelphia’s water is considered “moderately hard” or “hard”, depending on your service area.
Alkalinity in Tap Water
| Baxter WTP One Year Average | Belmont WTP One Year Average | Queen Lane WTP One Year Average | |
|---|---|---|---|
| Average | 42 ppm | 76 ppm | 72 ppm |
| Minimum | 23 ppm | 46 ppm | 52 ppm |
| Maximum | 58 ppm | 102 ppm | 95 ppm |

Top customer questions

Can I get my water tested?
Yes! We offer free testing for lead, copper, and other select water quality concerns.
We are seeing an increase in water quality testing requests. The results continue to show our treatment processes keep water safe.

How hard is Philadelphia’s water?
Philadelphia’s water is considered moderately hard. Hardness depends on the treatment plant that serves your area of the city.

Why do water utilities add fluoride to water?
It’s a natural element that helps prevent cavities. Philadelphia’s Health Department (and dentists) recommend we add fluoride to a level that helps protect children’s teeth.
Read more: Drinking Water FAQ

Why does my water look cloudy sometimes?
This is usually not a water quality issue. Water pressure in the main creates air bubbles in water. When you fill a glass with tap water, the bubbles rise from the bottom of the glass and are released at the top.
Call us to report a water quality issue if the bubbles don’t disappear after a few seconds.
Call us: (215) 685-6300

Should I use a filter?
The water we deliver to your property does not need a filter. Your plumbing can impact your water quality, especially when service lines are disturbed. This can happen during construction or repairs near your property. If you use a filter, you must follow all instructions from the manufacturer. It should be certified for lead reduction by the National Sanitation Foundation (NSF).
Learn more: NSF’s Water Filters FAQs

Why does water have an earthy flavor sometimes?
Earthy or musty flavors occur naturally in drinking water. When certain algae-type organisms grow in our rivers, detectable levels of these odors can make their way into the treated drinking water.
These natural compounds have no known health effects at their natural levels and are found in various foods.
We take steps to reduce their presence when detected.
Learn more: Drinking Water FAQ
Working together
You can help protect Philadelphia’s water quality.

Easy to do
Sign up to receive water quality updates & more!
Get the latest news, useful information, and find out about upcoming events.
Don’t litter: Keep trash out of our waterways.
Make sure to put your recyclable paper, metal, and plastics in a recycling bin. Put disposable gloves, masks, food waste, and other garbage in a trash can, so they don’t end up in our rivers and streams.
Get alerts & updates from the City of Philadelphia.
Sign up for emergency, traffic, weather, and safety information.
Text: READYPHILA to 888-777 or visit: phila.gov/ready
Dispose of things properly.
Always properly recycle or dispose of household hazardous wastes. Don’t flush them down the toilet or down the sink, and don’t pour them into storm drains. Many storm drains flow directly to our streams and rivers.
Don’t flush anything but toilet paper. Yes, even “flushable” wipes! They don’t dissolve like toilet paper and can lead to clogs and backups, causing waste to flow into our homes and our streets.
See us in person
Visit the Fairmount Water Works Interpretive Center.
The Fairmount Water Works Interpretive Center is a great resource for educational programming and information. Topics include our water infrastructure and watersheds, local native wildlife, and STEAM (science, technology, engineering, arts, and math) activities.
Learn more: fairmountwaterworks.org
Enjoy top-quality tap at the Philly Water Bar.
The Philly Water Bar is a relationship-building tool and interactive platform that educates and engages the public around Philadelphia’s top-quality tap water.
Learn more about upcoming Water Bar events
Join a cleanup.
Group cleanups help remove trash and litter from our waterways. There are a number of ways to stay informed about upcoming cleanups:
Visit the @PhillyH2O blog, follow us on social media (@phillyh2o), email us at waterinfo@phila.gov, call us at (215) 685-6300, or sign up for event information.
Request a tour.
You can request to tour a Water Treatment Plant to learn more about how we test and treat our water. You can also request to visit a stormwater management site to learn how Philadelphia is using green infrastructure to keep our water cleaner and make our city greener.
Request a tour: waterinfo@phila.gov