There is a newer version of this page available, featuring the latest Water Quality Report! Check it out →
Tap you can trust.
How we make top-quality tap water in Philadelphia
Your tap is locally sourced.
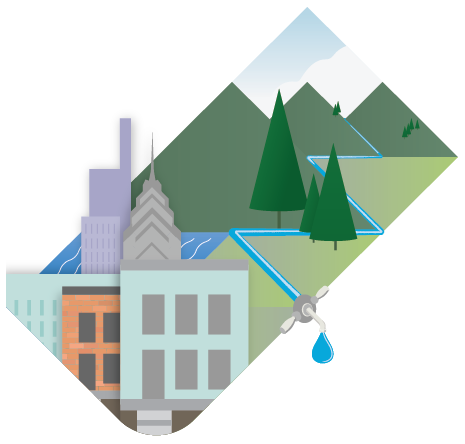
Water from our rivers is treated to the highest standards.
about this page
We monitor water quality at every step to ensure safety when it gets to you.
This is a quick-read guide to many of the test results we share in our annual Drinking Water Quality Report.
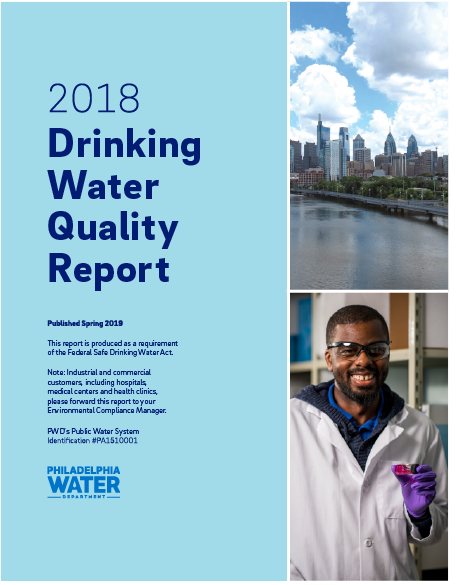
If you like what you see here and want more details and science, check out our latest full report!
Part 1
Source
Locally sourced,
locally made

Part 2
Delivery
Safe transit through
the system
Part 3
At home
The final stretch
to your tap
Throughout this page, look for Lab Notes…
These notes explain how we test, and what the results mean for you.
source

Locally sourced, locally made
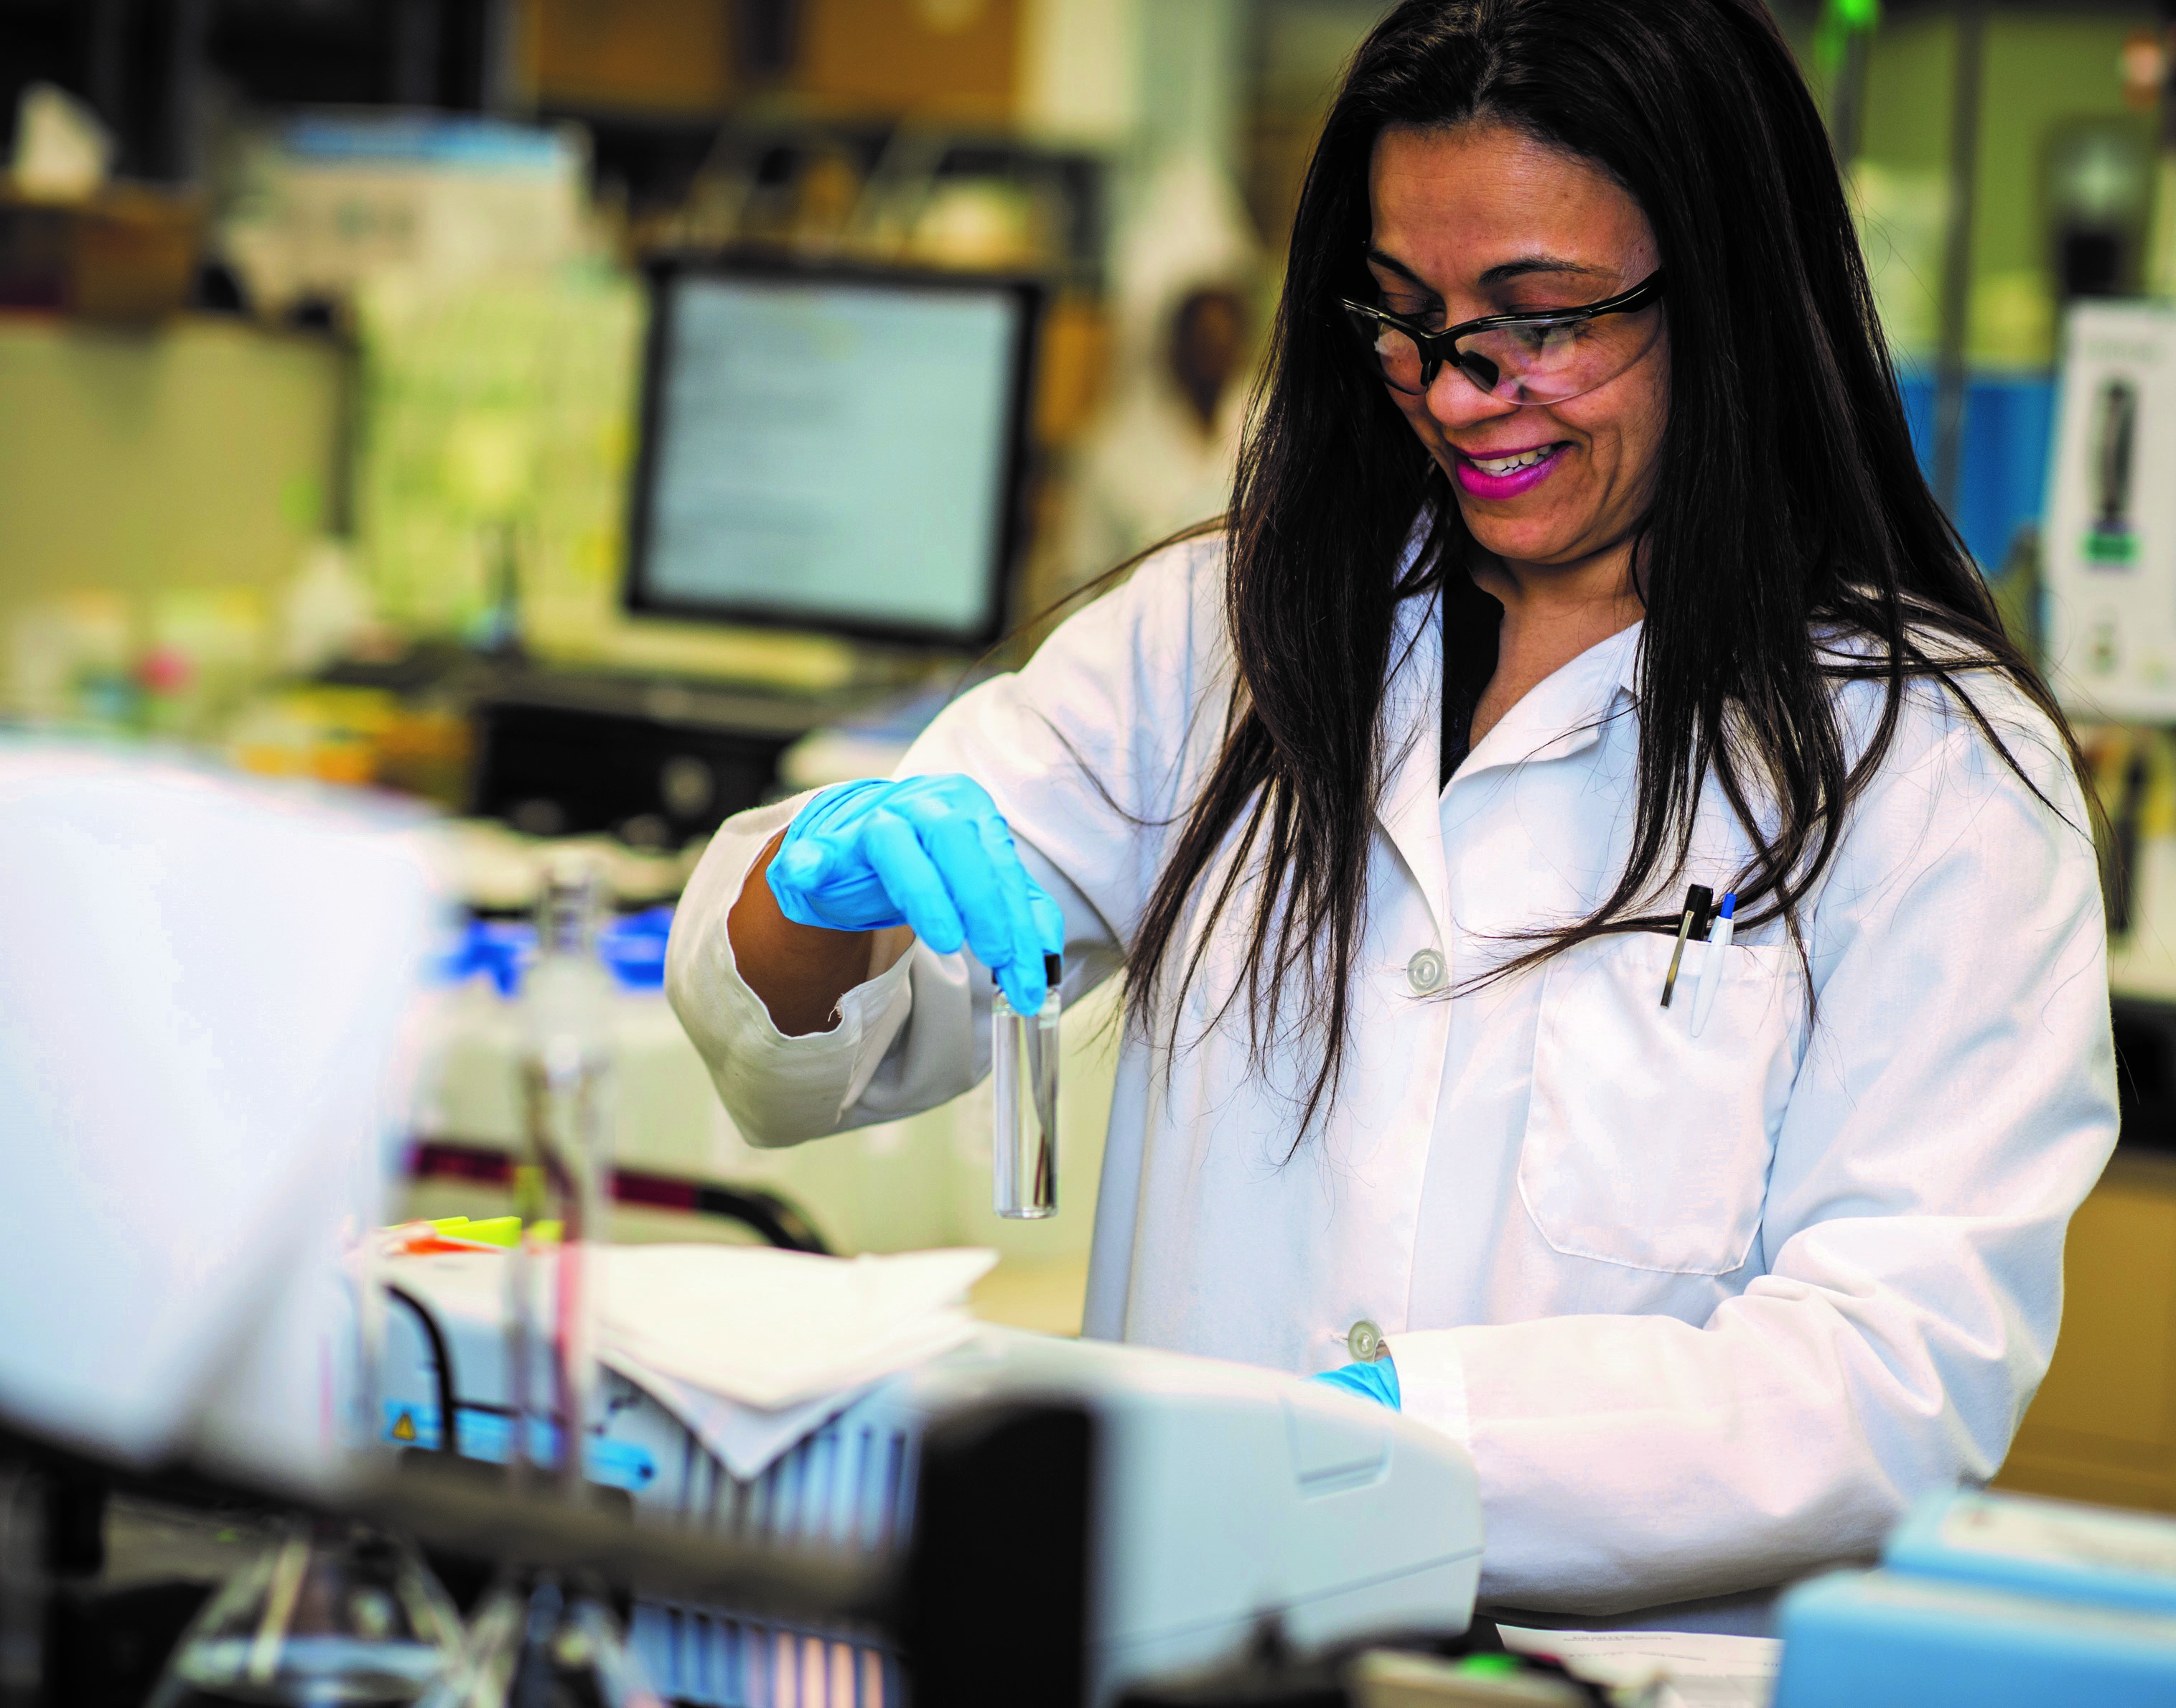
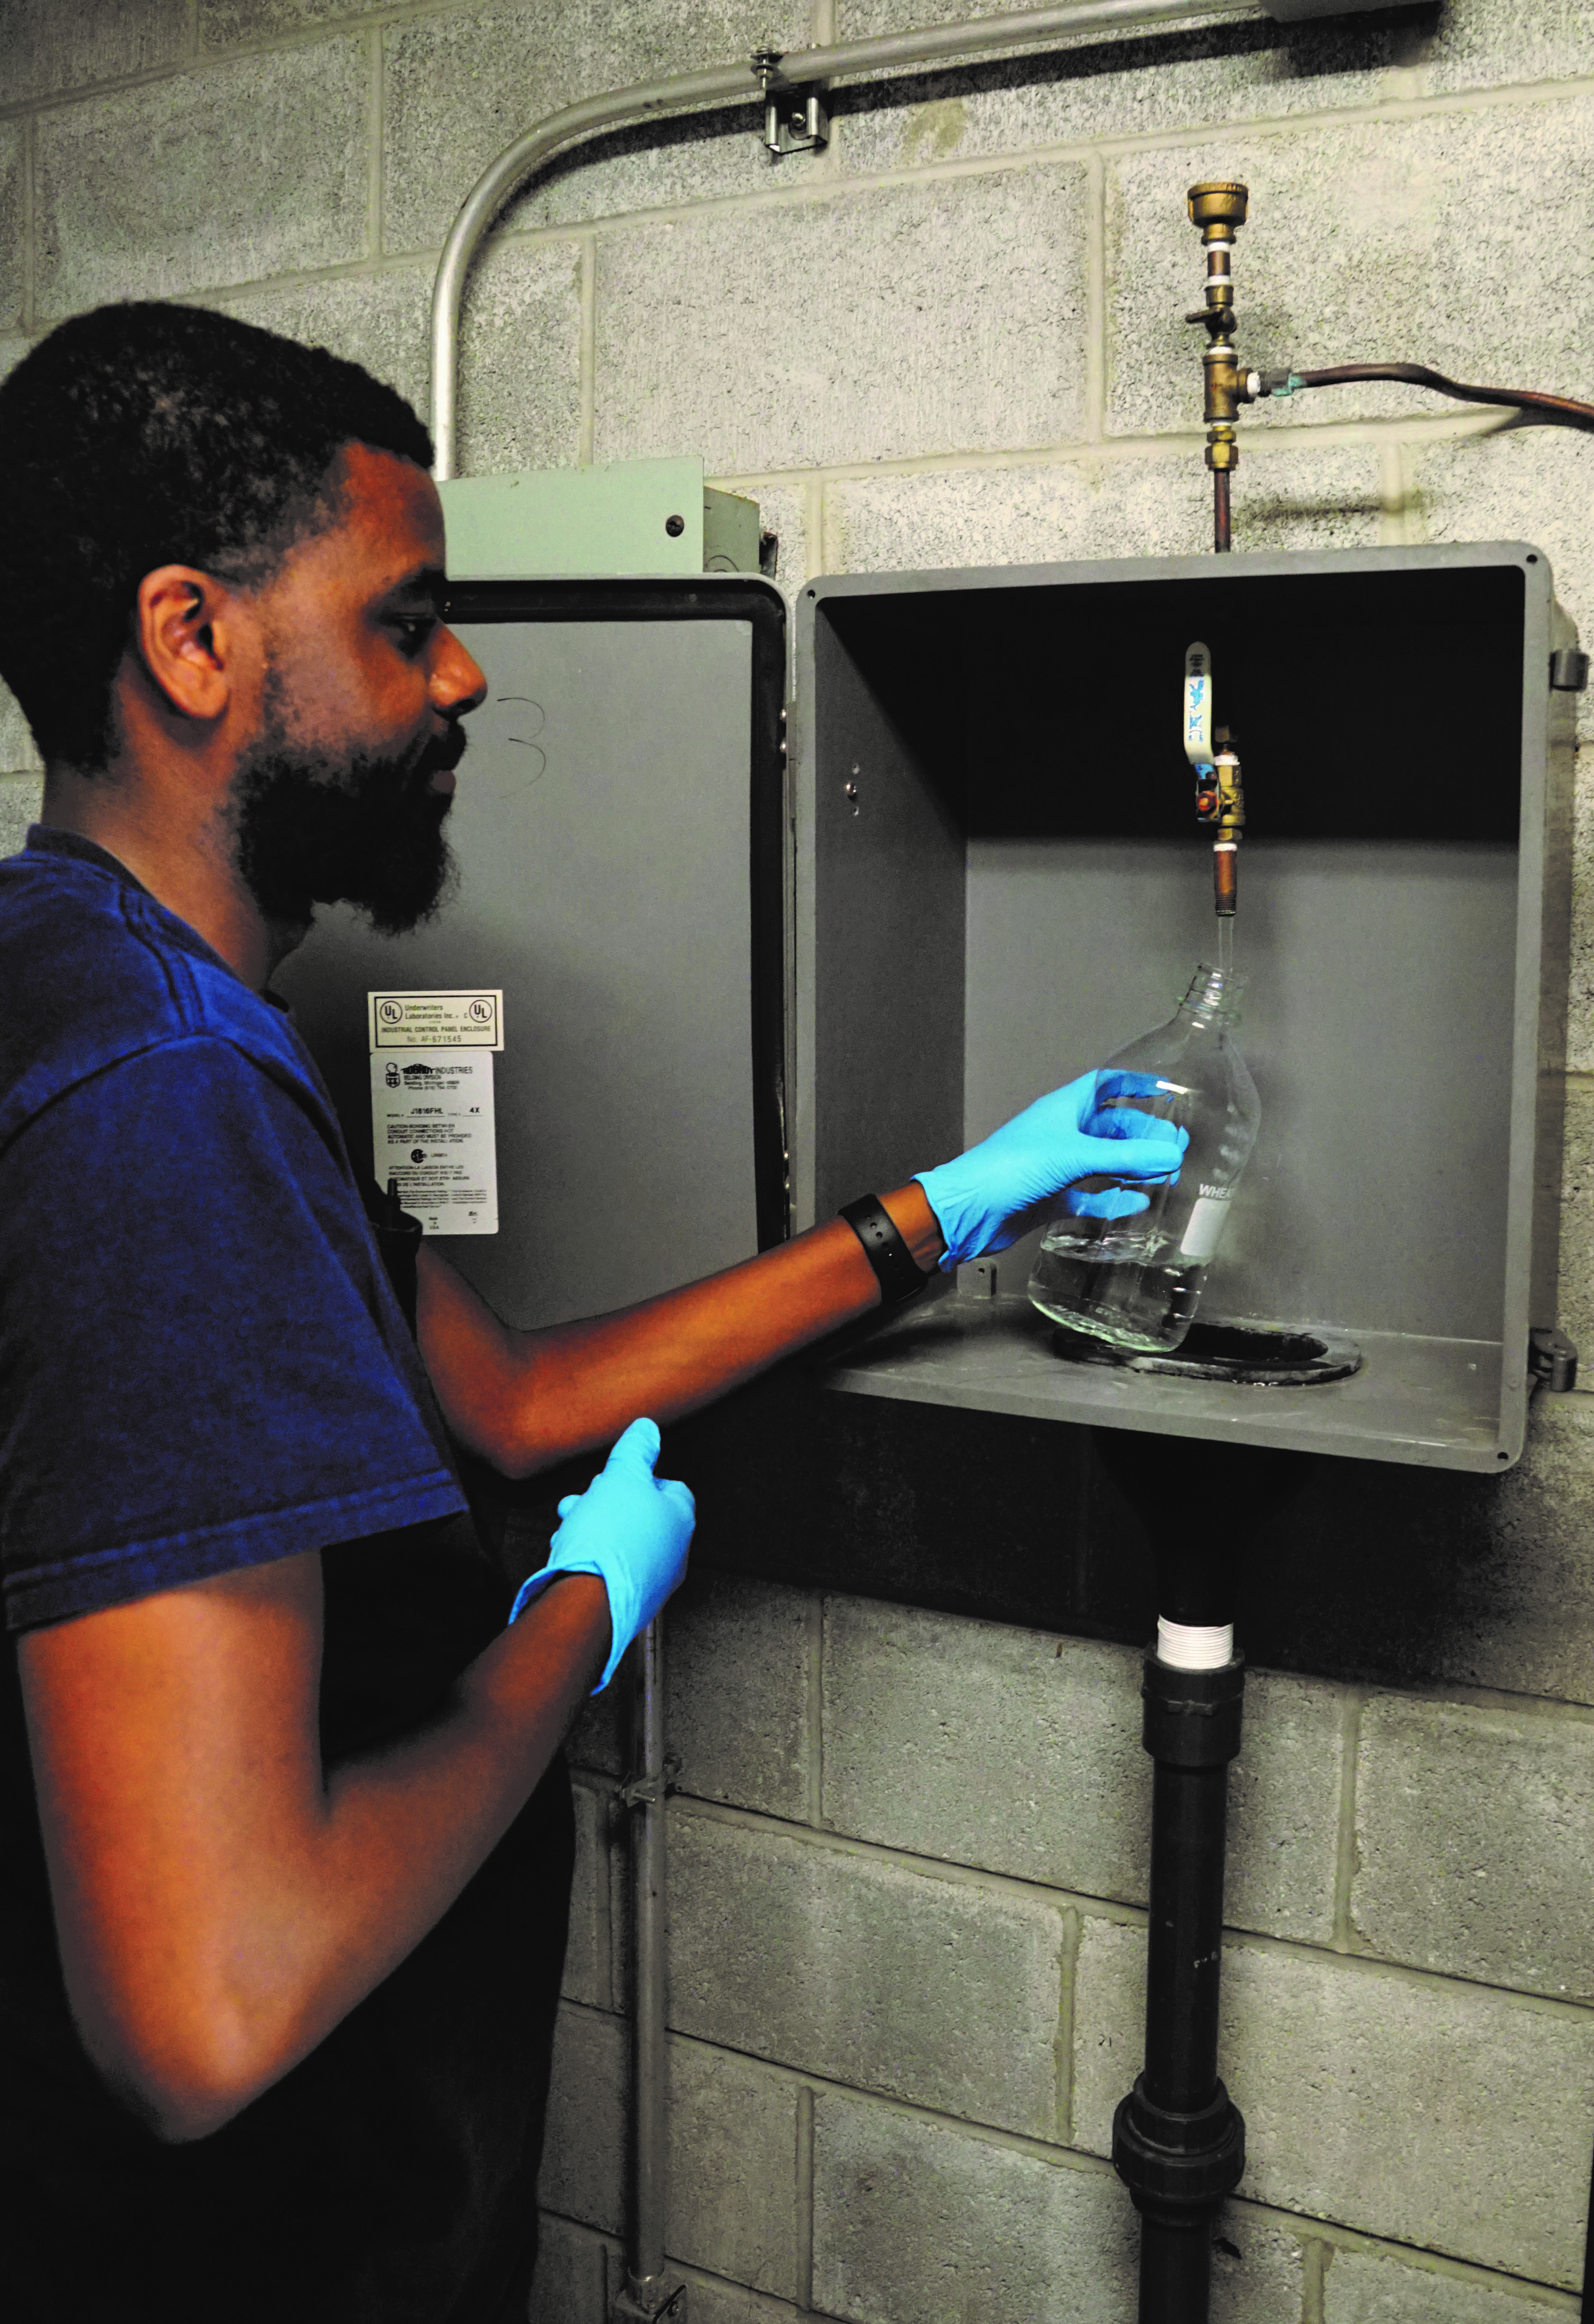
The experts working in our treatment plants take pride in using water drawn from our local rivers.
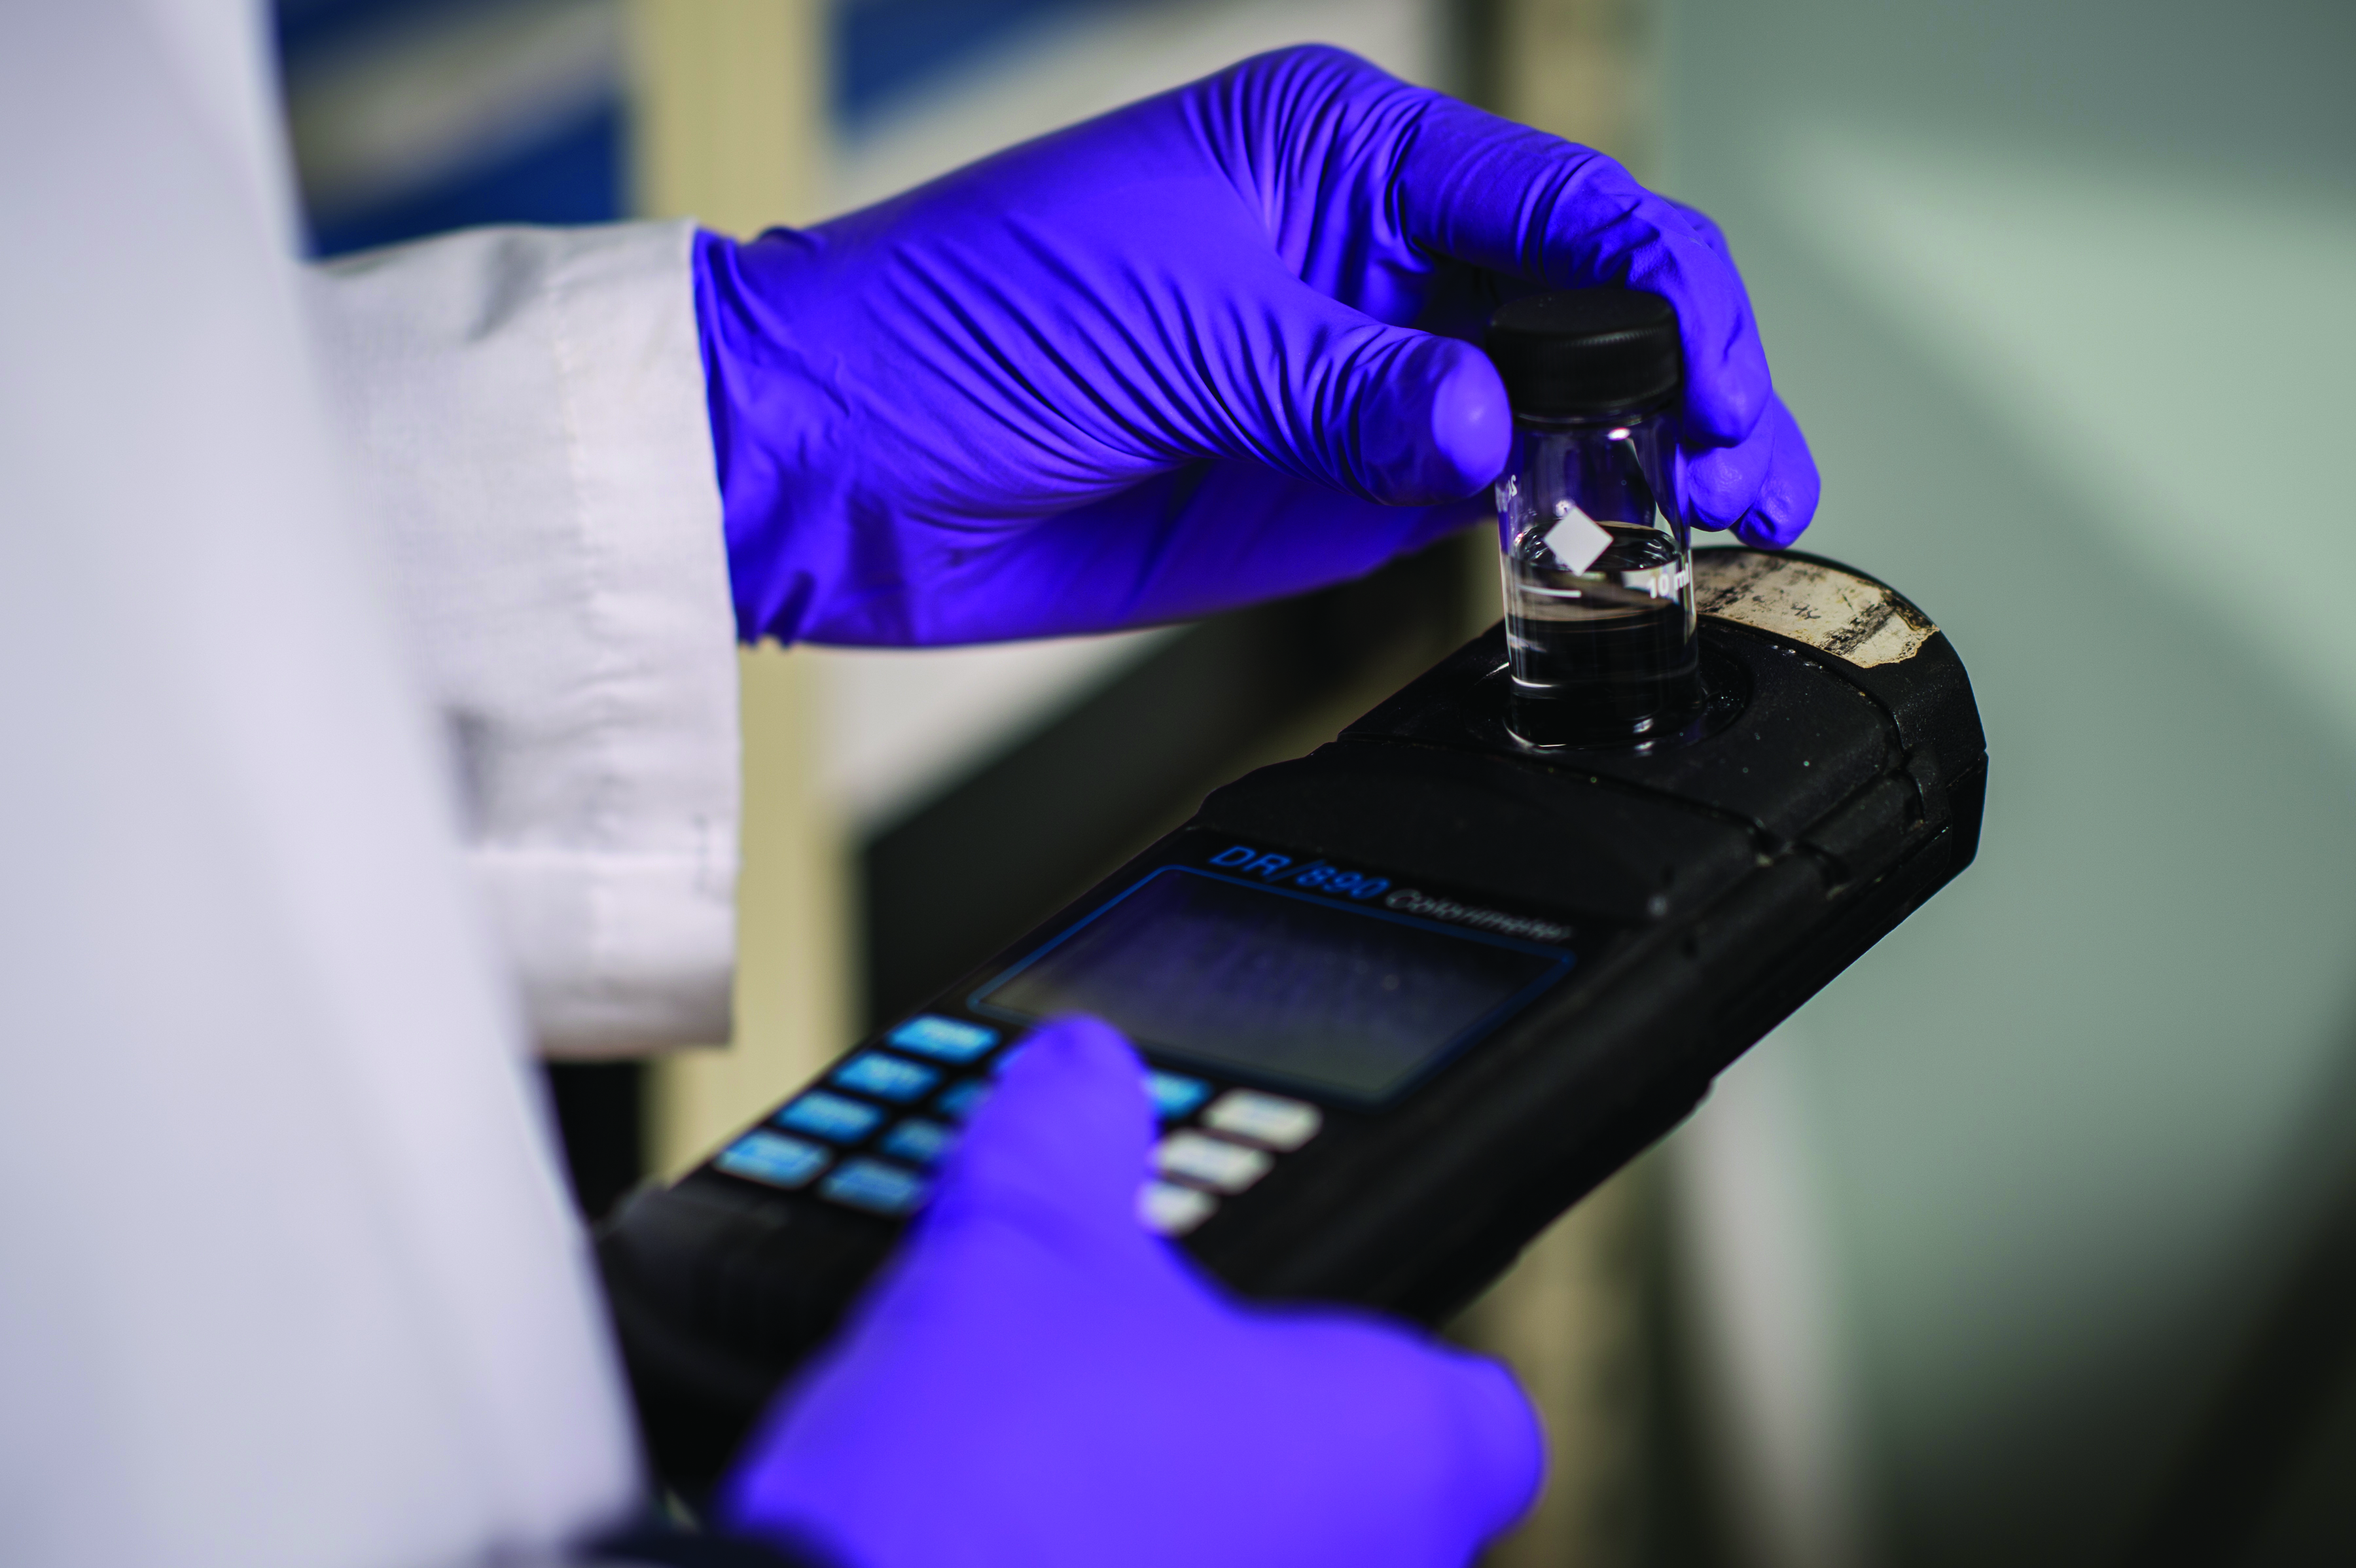
Testing quality at treatment plants
Once collected, river water goes through multiple processes, including settling, disinfection, and filtering. We ensure it’s crystal clear and safe.
We test it again once more to make sure the water will stay safe on its way to your tap.
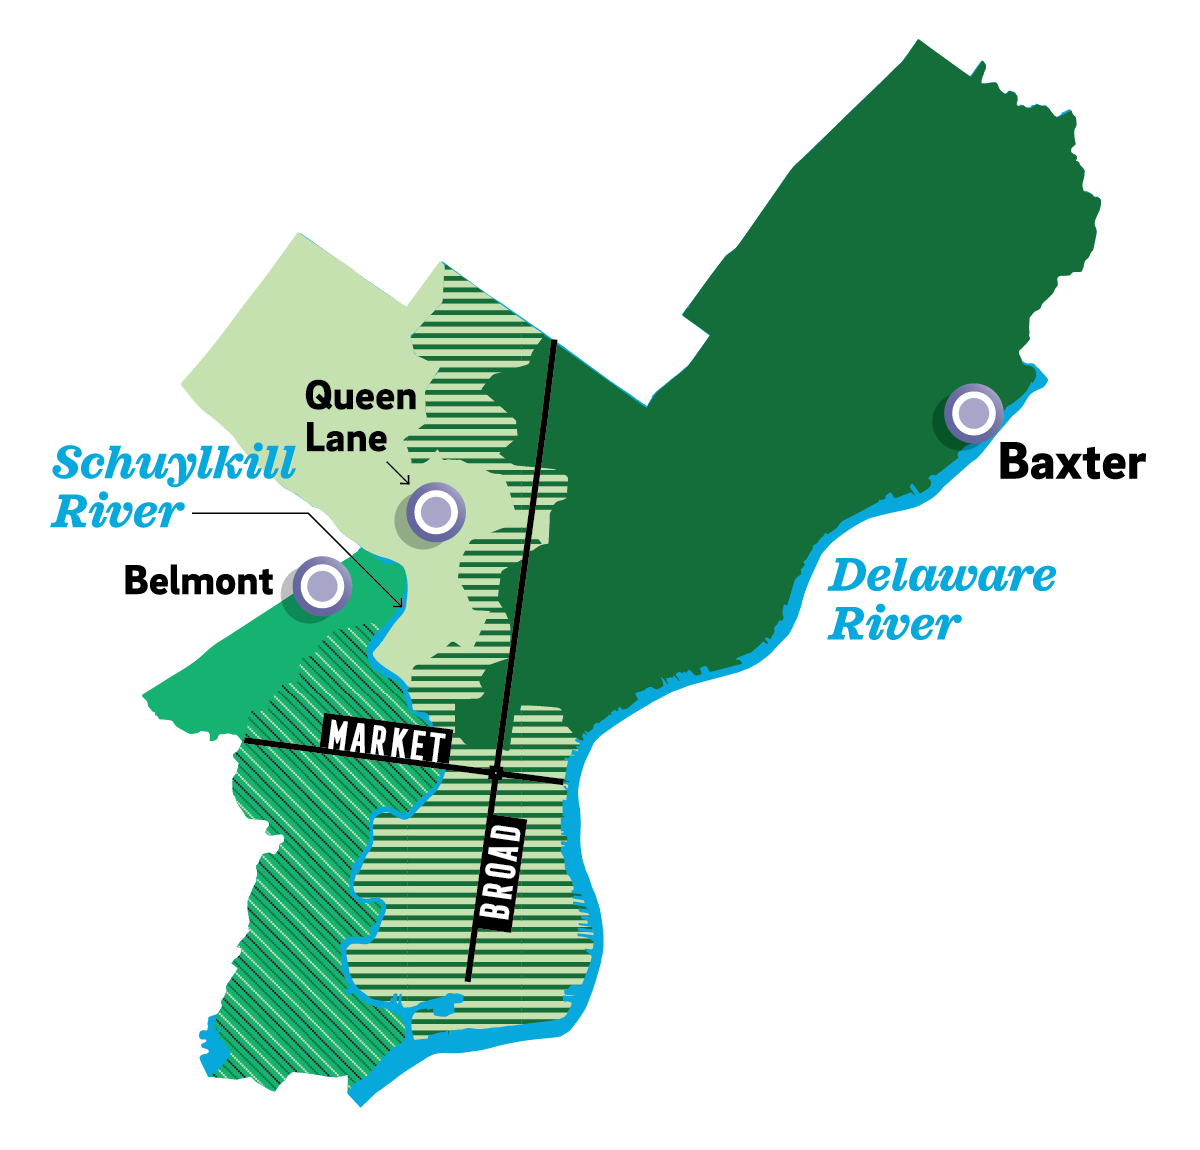
What water treatment plant serves your area of the city?
Final Ingredients
Chlorine + Ammonia
Chlorine protects us from disease-causing organisms found in natural water. Ammonia is added to make chlorine last longer and reduce the bleach-like smell.
Fluoride
We adjust natural levels to help protect children’s teeth.
Zinc orthophosphate
Coats pipes to prevent corroding (or breaking down) over time.
Before it leaves the plant
Consistent Quality
We constantly test our treated water for about 100 regulated contaminants, ranging from organisms like bacteria to chemicals like nitrate. No tests in 2018 found levels considered violations under state and federal regulations.
A Closer Look at Hardness
The hardness of water is determined by the calcium and magnesium carbonates naturally dissolved in it. Hardness can vary based on natural conditions. For example, during a drought the hardness of water increases as the calcium carbonates in the natural waters become more concentrated.
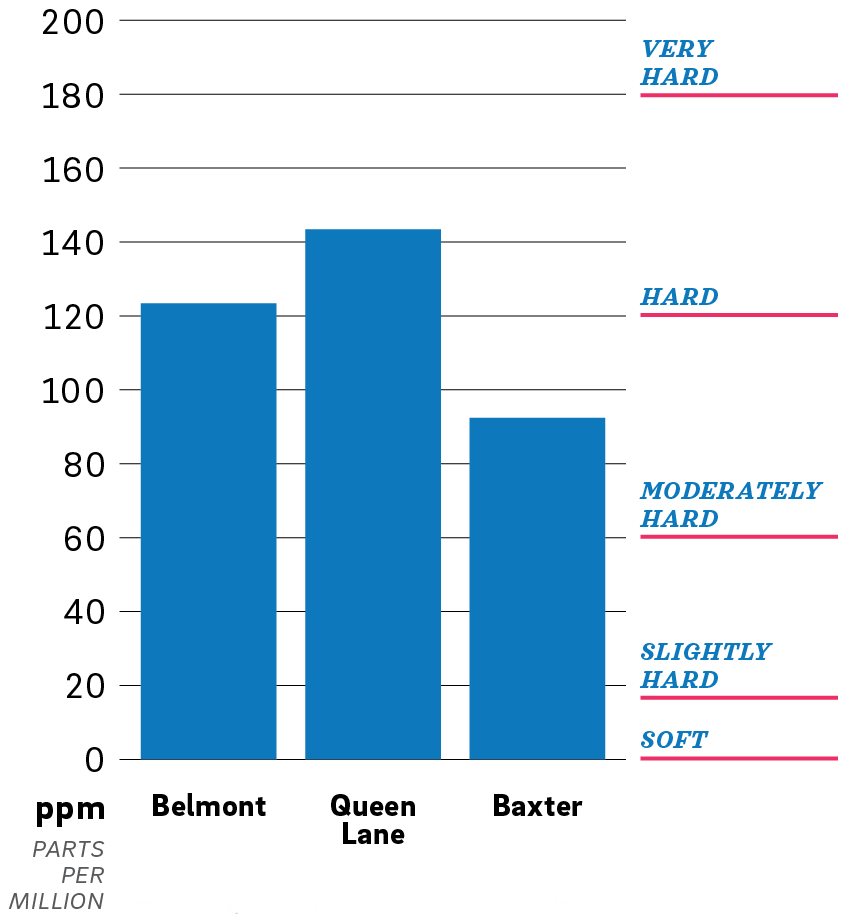
☑ Result:
Philadelphia’s water is moderately hard or hard, depending on which treatment plant serves your neighborhood.
Hardness matters if you use water for activities like brewing or aquariums.
Most customers don’t need to treat their water for hardness.
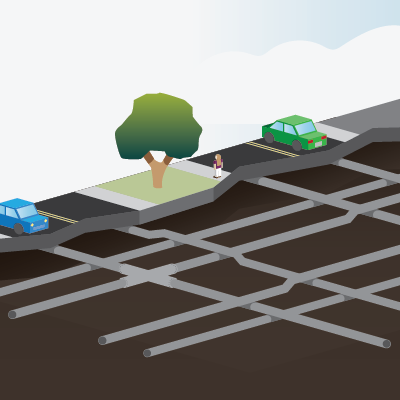
delivery
Safe transit through the system
We have about 3,100 miles of water mains that deliver clean tap to customers. To ensure water stays safe as it moves from the plant to you, we take samples and use online monitoring to track real-time water quality data, 24/7.
A Closer Look at Residual Chlorine
This test is done throughout the system. It checks that the chlorine added at plants is still at levels that keep water fresh and safe while staying within regulations.
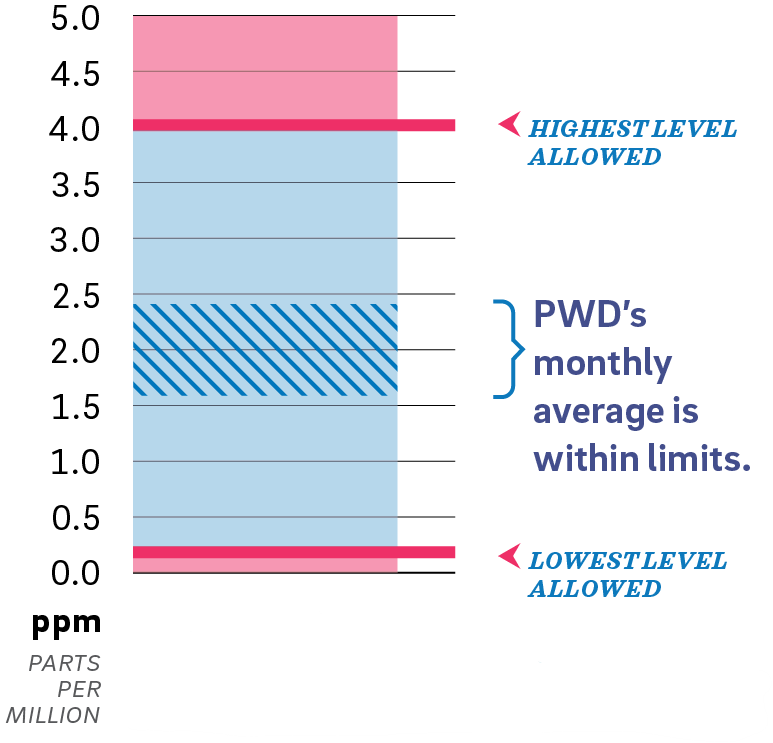
☑ RESULT:
Better than standards
We travel the city to collect samples of drinking water from fire and police stations, pumping stations, and more.
We do over 420 of these tests per month!
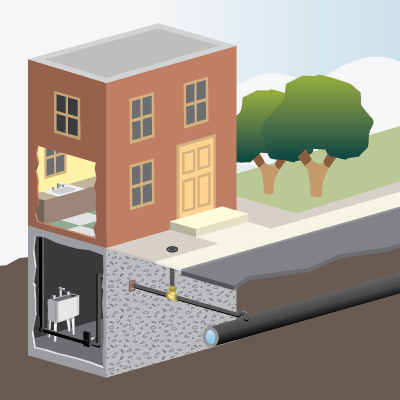
at home
The final stretch to your tap
Once it leaves our water main and enters your service line, there are things you can do to keep your water safe.
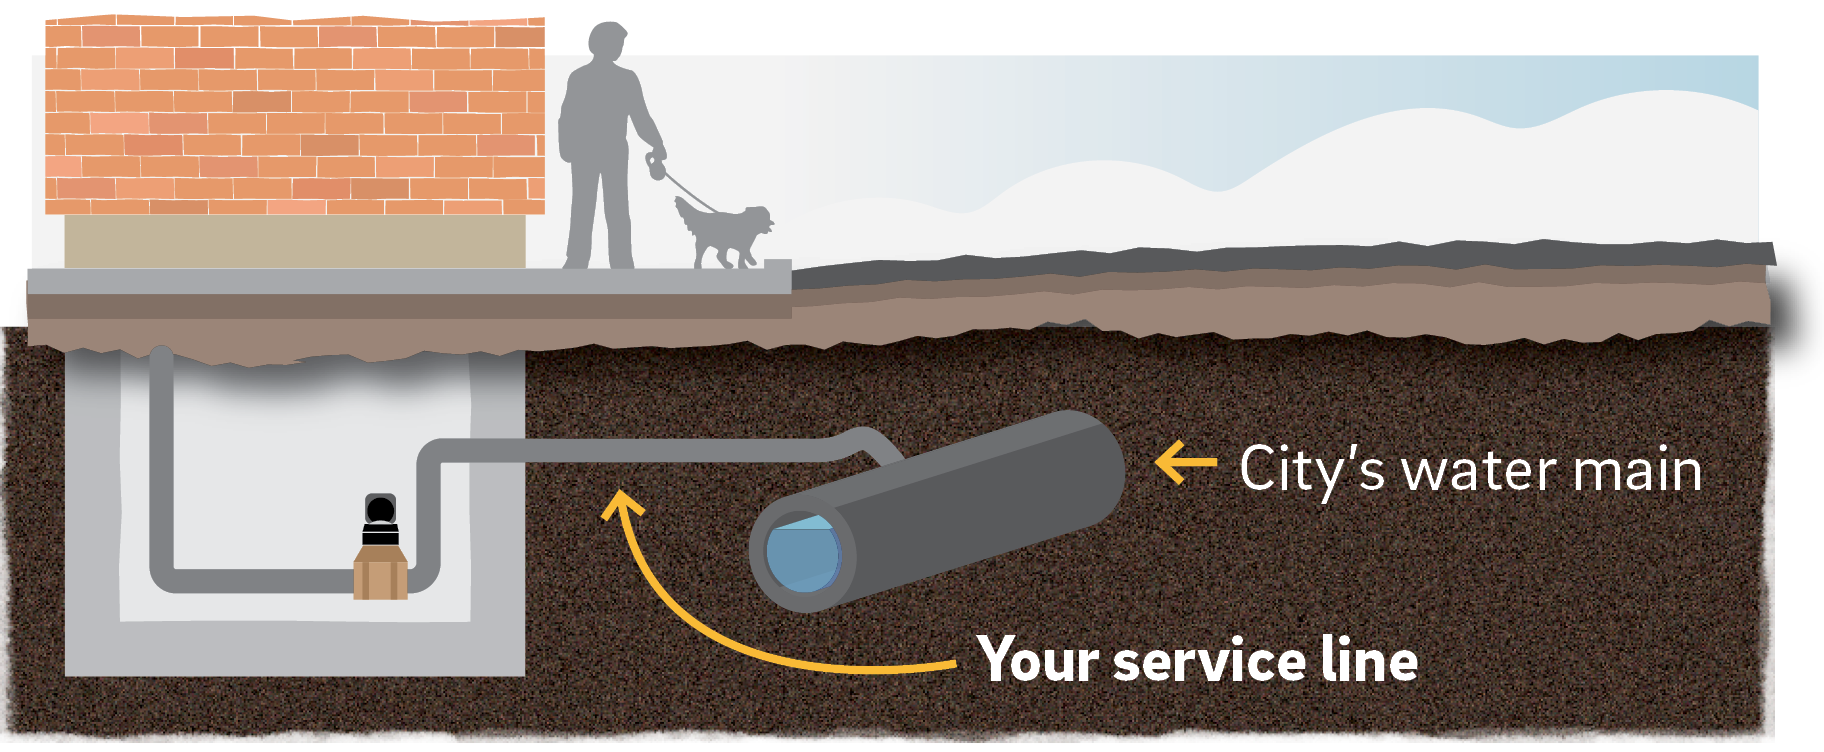
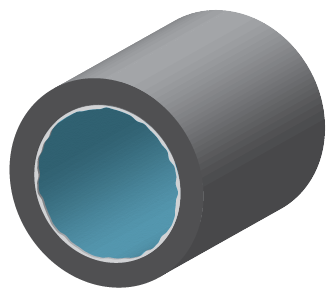
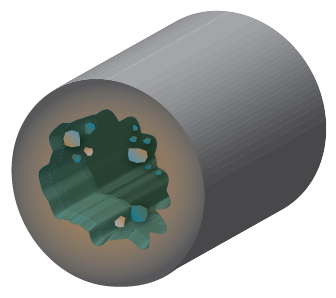
Your Plumbing
The water we send to you does not contain lead. But lead may be found in a customer’s service line, or in other home plumbing.
Replacing Service Lines
If you have a service line made of lead, we want to help! See the next section…
Healthy Home Habit
If you haven’t used water for 6 hours or more: Run your cold water for 3-5 minutes. This will flush out water that’s been sitting in your pipes.
It only costs a penny or two to ensure top-quality tap!
A Closer Look at Carefully Monitoring Lead
In addition to regular tests in customer homes, every three years we complete a rigorous round of sampling for lead and copper. We share the results with the EPA and the public.
The EPA requires that 90% of homes with lead service lines sampled show lead levels less than 15 ppb.
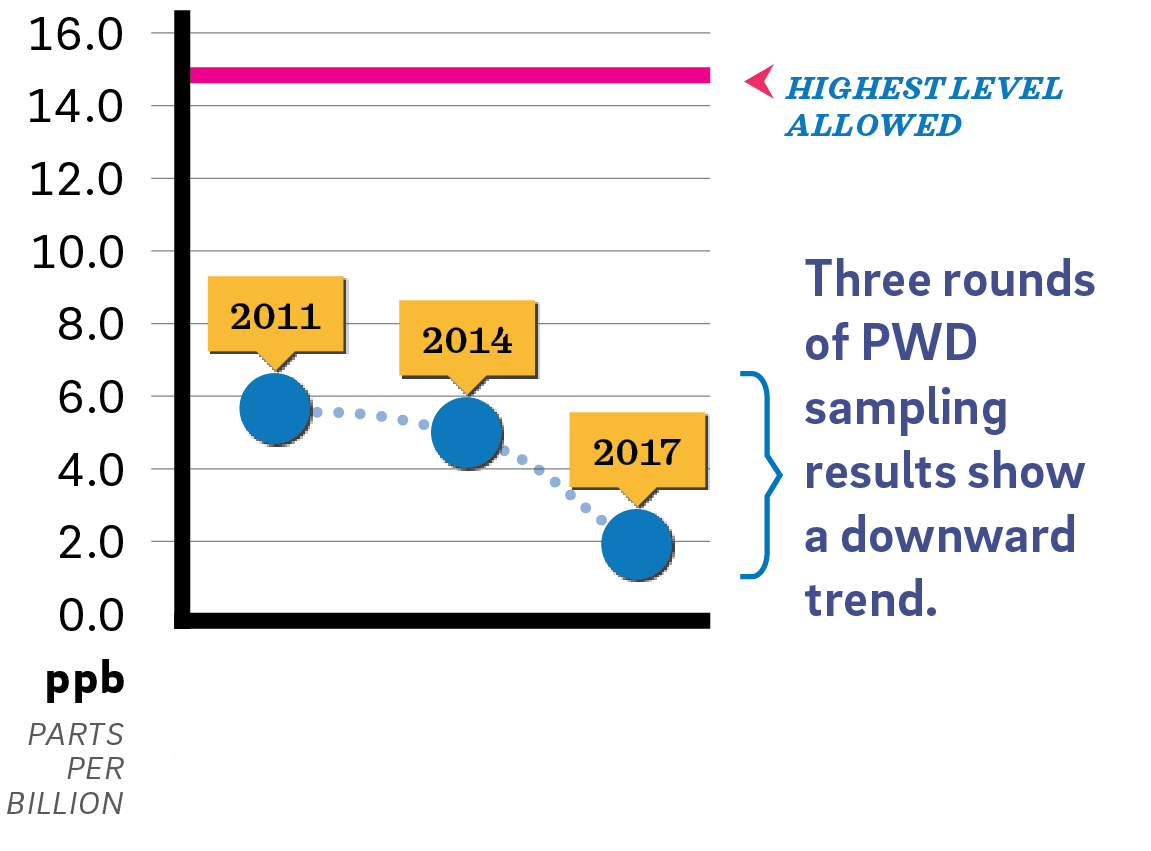
☑ RESULT:
Lead levels are consistently lower than limits set by the EPA.
Our treatment is effective. But we want to go further. We’re commited to helping customers replace their lead service lines.
frequently asked questions
Why do water utilities add fluoride to water?

It’s a natural element that helps prevent cavities. Philadelphia’s Health Department (and dentists) recommend we add fluoride to a level that helps protect children’s teeth.
How hard is Philadelphia’s water?
Philadelphia’s water is considered moderately hard. Hardness depends on the treatment plant that serves your area of the city. See A Closer Look at Hardness.
Why does my tap water smell like a pool sometimes?

The smell of chlorine means your water is safe and treated to remove harmful organisms. You can reduce the smell by keeping a pitcher of fresh water in the refrigerator. This also reduces the earthy odor, sometimes produced by algae in the rivers during spring.
What are PFAS?
Per- and polyfluoralkyl substances (PFAS) are human made chemicals that have been used in industry and many consumer products. Initial research suggests some PFAS have been tentatively linked to health problems.
Groundwater vs. River water:
Pfas are more of a concern in groundwater (water drawn from underground). Your water comes from local rivers.
We proactively test for PFAS and have not detected concentrations above an Environmental Protection Agency advisory level set in 2016.
Can I replace a lead service line?
Yes. If you don’t want to contact a plumber directly, apply for our Homeowners Emergency Loan Program (HELP). A zero-interest loan can cover the cost of replacement.
Also: PWD will replace lead service lines for free if they are discovered during planned work on water mains.
How do I get my water tested?
We offer free lead and coper tests for residential customers who have concerns about their water.
Call (215) 685-6300 to request an appointment
Tip:
Colder tastes better!
Water’s flavor is improved by colder temperatures.
Keep a covered pitcher in the fridge!