2025
Drinking Water Quality Report Wholesale Customer Excerpt
Published in 2026
This report is produced for you as a requirement of the Federal Safe Drinking Water Act.
Note: Industrial and commercial customers, including hospitals, medical centers, and health clinics, please forward this report to your Environmental Compliance Manager.
Philadelphia Water Department’s (PWD) Public Water System Identification: #PA1510001
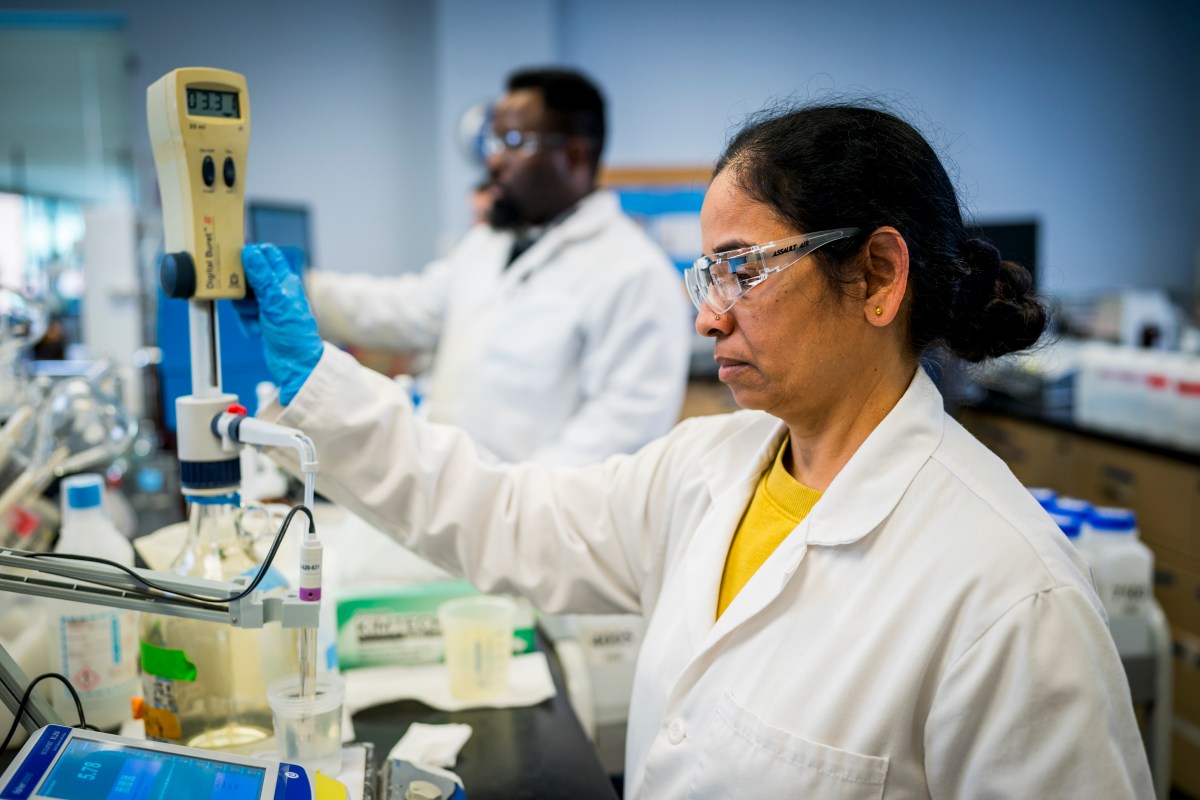
PWD staff testing treated drinking water for general water quality.
Contents
- About the Wholesale Customer Excerpt
- Glossary
- What we test for and how
- 2025 Data tables
-
- Lead & Copper
- Inorganic Chemicals (IOC)
- Radiological Contaminants
- Total Chlorine Residual (at Water Treatment Plants)
- Total Chlorine Residual (distribution)
- Secondary Chemicals
- Bacteria in Tap Water
- Total Organic Carbon
- Synthetic Organic Chemicals (SOC)
- Turbidity
- Disinfection By-Products
- PFAS
- Unregulated Contaminant Monitoring (UCMR)
- Unregulated contaminants not detected at any of the sampling locations
- Sodium, Hardness, and Alkalinity in Tap Water
-

PWD staff collect samples of drinking water from fire and police stations around Philadelphia.
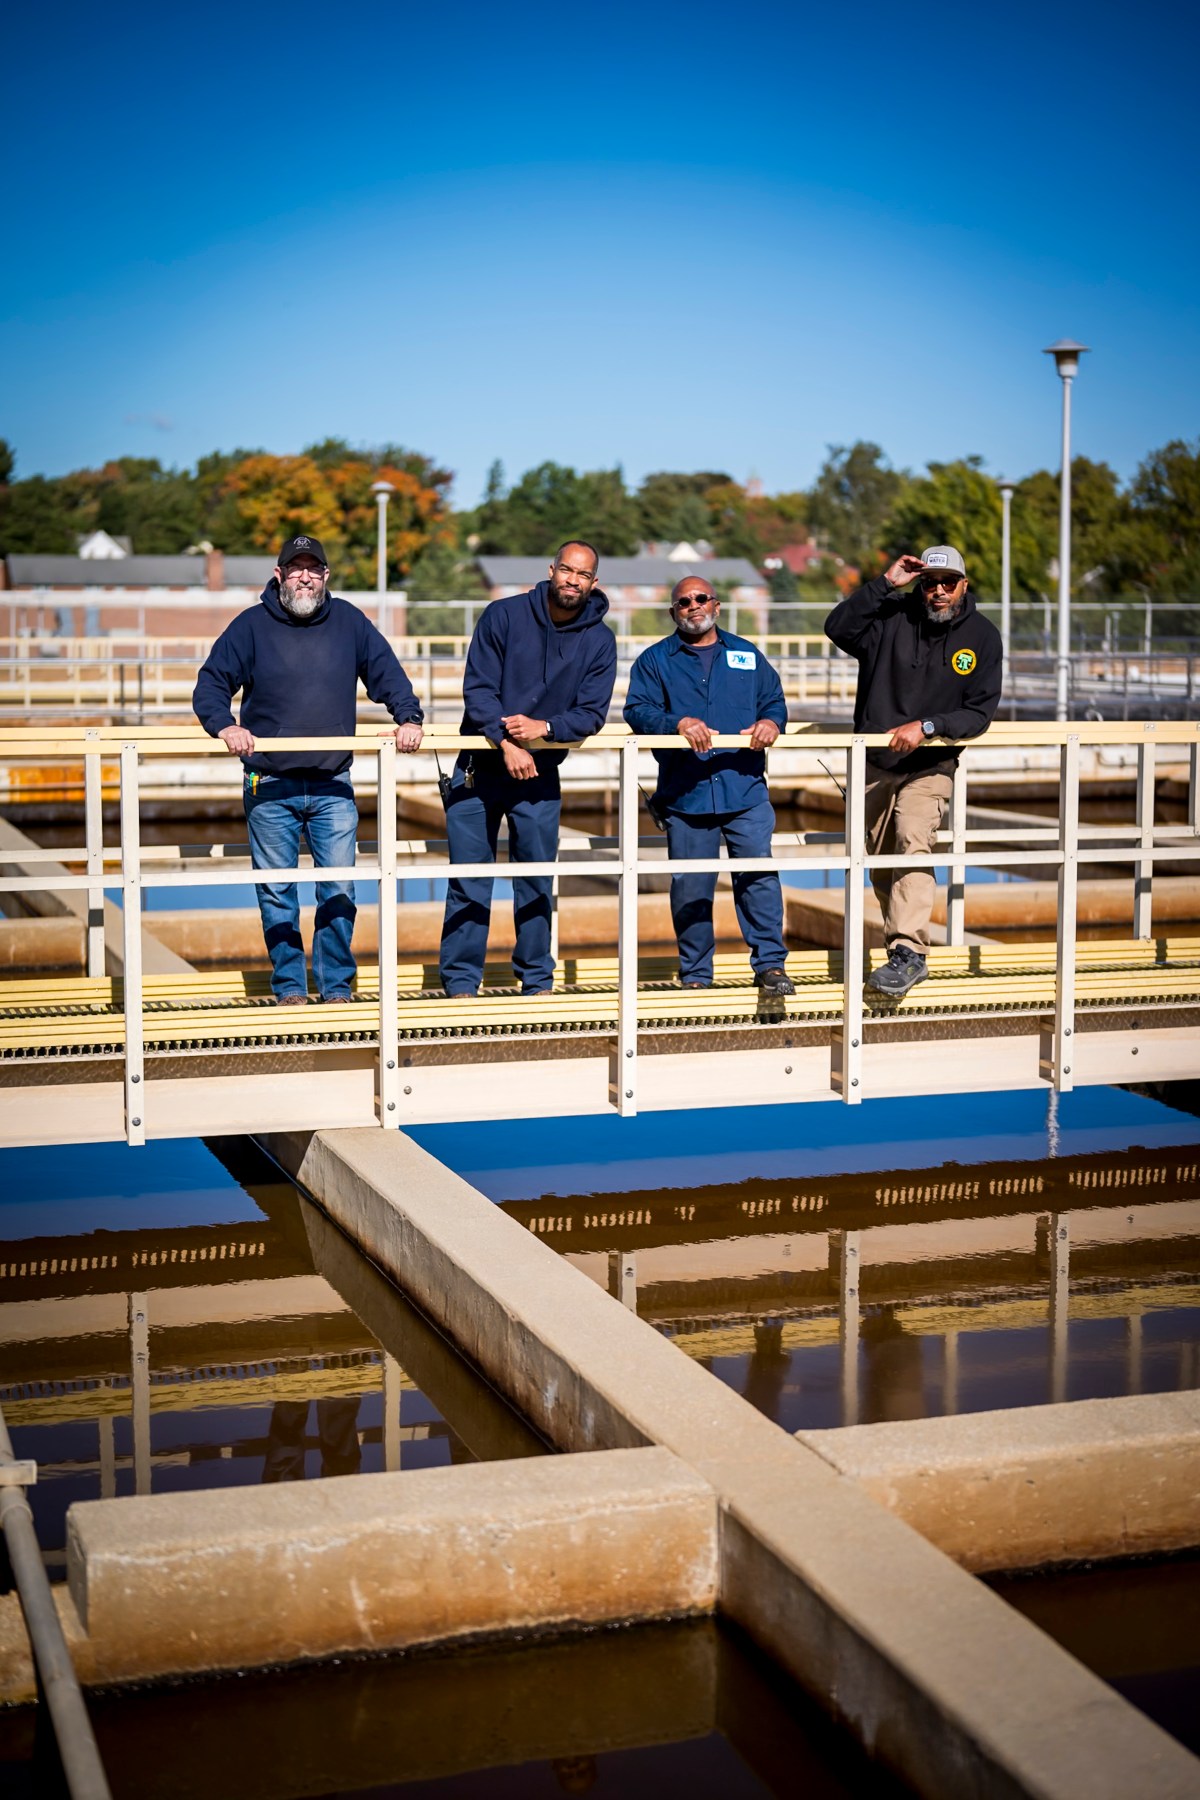
PWD staff at a Drinking Water Treatment facility in Philadelphia.
About the Wholesale Customer Excerpt
We share our data tables in this format for industrial/commercial customers and consecutive water systems.
Consecutive water systems are public water systems that obtain their water from another public water system and resell the water, provide treatment, or provide drinking water to an interstate carrier. The term does not include bottled water and bulk water systems.
Typical Treatment Processes
These are some of the stages water goes through during normal operating conditions.

Glossary
Here are definitions for some words and phrases we use in the report and in our data tables.
- Action Level: The concentration of a contaminant which, if exceeded, triggers treatment or other requirements that a water system must follow. The action level is not based on one sample; instead, it is based on many samples.
- Alkalinity: A measure of the water’s ability to resist changes in the pH level and a good indicator of overall water quality. Although there is no health risk from alkalinity, we monitor it to check our treatment processes.
- E. coli (Escherichia coli): A type of coliform bacteria that is associated with human and animal fecal waste.
- gpg (grains per gallon): A unit of water hardness. One grain per gallon is equal to 17.1 parts per million.
- Level 1 Assessment: A study of the water system to identify potential problems and determine (if possible) why total coliform bacteria have been found in our water system.
- Level 2 Assessment: A very detailed sturdy of the water system to identify potential problems and determine (if possible) why an E. coli MCL violation has occurred and/or why total coliform bacteria have been found in our water system on multiple occasions.
- Locational Running Annual Average (LRAA): We calculate the average of samples taken from each location every quarter (3 months), and then the average of the last four quarterly averages to get the LRAA.
- MCL (Maximum Contaminant Level): The highest level of a contaminant that is allowed in drinking water. MCLs are set as close to the MCLGs as feasible using the best available treatment technology.
- MCLG (Maximum Contaminant Level Goal): The level of a contaminant in drinking water below which there is no known or expected risk to health. MCLGs allow for a margin of safety.
- MRDL (Maximum Residual Disinfection Level): The highest level of disinfectant that is allowed in drinking water. The addition of a disinfectant is necessary for the control of microbial contaminants.
- MRDLG (Maximum Residual Disinfection Level Goal): The level of a disinfectant in drinking water below which there is no known or expected risk to health. MRDLGs do not reflect the benefits of the use of disinfectants to control microbial contaminants.
- Minimum Residual Disinfection Level: The minimum level of residual disinfectant required at the entry point to the distribution system
- NTU (nephelometric turbidity units): Turbidity is measured with an instrument called a nephelometer. Measurements are given in nephelometric turbidity units.
- Pathogens: Bacteria, virus, or other microorganisms that can cause disease.
- pCi/L (Picocuries per liter): A measure of radioactivity.
- PFAS: Human-made perfluoroalkyl and polyfluoroalkyl substances used in industrial applications and a wide range of consumer products. PFAS compounds are found around the world and are not solely in water.
- ppm (parts per million): Denotes 1 part per 1,000,000 parts, which is equivalent to two thirds of a gallon in an Olympic-sized swimming pool.
- ppb (parts per billion): Denotes 1 part per 1,000,000,000 parts, which is equivalent to half a teaspoon in an Olympic-sized swimming pool.
- μg/L (Microgram per liter): One microgram per liter is equal to one part per billion.
- ppt (parts per trillion): Denotes 1 part per 1,000,000,000,000 parts, which is equivalent to one drop in 20 Olympic-sized swimming pools.
- SMCL (Secondary Maximum Contaminant Level): Non-enforcable Federal water quality guidelines that are established for managing aesthetic and cosmetic conditions of water (e.g. taste, odor, color).
- SOC (Synthetic Organic Chemical): Commercially made organic compounds, such as pesticides and herbicides.
- Total Coliform: Coliforms are bacteria that are naturally present in the environment. Their presence in drinking water may indicate that other potentially harmful bacteria are also present.
- THAAs (Total Haloacetic Acids): A group of chemicals known as disinfection byproducts. These form when a disinfectant reacts with naturally occurring organic and inorganic matter in the water.
- TOC (Total Organic Carbon): A measure of the carbon content of organic matter. This measure is used to indicate the amount of organic material in the water that could potentially react with a disinfectant to form disinfection byproducts.
- TTHMs (Total Trihalomethanes): A group of chemicals known as disinfection byproducts. These form when a disinfectant reacts with naturally occurring organic and inorganic matter in the water.
- Treatment Technique: A required process intended to reduce the level of a contaminant in drinking water.
- Turbidity: A measure of the clarity of water related to its particle content. Turbidity serves as an indicator for the effectiveness of the water treatment process. Low turbidity measurements, such as ours, show the significant removal of particles that are much smaller than can be seen by the naked eye.
- VOC (Volatile Organic Chemicals): Organic chemicals that can be either man-made or naturally occurring. These include gases and volatile liquids.
- WTP: Water Treatment Plant
What we test for and how
Public drinking water systems monitor their treated drinking water for approximately 100 regulated contaminants. These regulatory parameters are defined within federal rules, such as the Revised Total Coliform Rule, Surface Water Treatment Rule, Disinfectants and Disinfection Byproducts Rules, Lead and Copper Rule, and the Radionuclides Rule.
We monitor for the regulated parameters listed below.
Any contaminants found are noted in the tables on the following pages.
Inorganic Chemicals
- Antimony
- Arsenic
- Barium
- Beryllium
- Cadmium
- Chromium
- Copper
- Cyanide
- Fluoride
- Lead
- Mercury
- Nickel
- Nitrate
- Nitrite
- Selenium
- Thallium
Synthetic Organic Chemicals
- 2,3,7,8 – TCDD (Dioxin)
- 2,4 – D, 2,4,5 – TP (Silvex)
- Alachlor
- Atrazine
- Benzopyrene
- Carbofuran
- Chlordane
- Dalapon
- Di(ethylhexyl) adipate
- Di(ethylhexyl) phthalate
- Dibromochloropropane
- Dinoseb
- Diquat
- Endothall
- Endrin
- Ethylene Dibromide
- Glyphosate
- Heptachlor
- Heptachlor epoxide
- Hexachlorobenzene
- Hexachlorocyclopentadiene
- Lindane
- Methoxychlor
- Oxamyl
- PCBs Total
- Pentachlorophenol
- Picloram
- Simazine
- Toxaphene
Volatile Organic Chemicals
- Benzene
- Carbon Tetrachloride
- 1,2-Dichloroethane
- o-Dichlorobenzene
- p-Dichlorobenzene
- 1,1-Dichloroethylene
- cis-1,2-Dichloroethylene
- trans-1,2-Dichloroethylene
- Dichloro-methane
- 1,2-Dichloropropane
- Ethylbenzene
- Monochlorobenzene
- Styrene
- Tetrachloroethylene
- Toluene
- 1,2,4-Trichlorobenzene
- 1,11-Trichloroethane
- 1,1,2-Trichloroethane
- Trichloro-ethylene
- o-Xylene
- m,p-Xylenes
- Vinyl Chloride
Radiological Contaminants
- Uranium
- Alpha Emitters
- Radium 226
- Radium 228
Perfluoroalkyl and Plyfluoroalkyl Substances
- PFOA
- PFOS
- PFNA
- PFBS
- PFHxS
- HFPO-DA (GenX)
Other factors that can impact drinking water
Appealing to Your Senses

We work to ensure your water looks, tastes and smells the way it should.

To meet all water quality taste and odor guidelines, we test for the following: alkalinity, aluminum, chloride, color, hardness, iron, manganese, odor, pH, silver, sodium, sulfate, surfactants, total dissolved solids, turbidity, and zinc.
Temperature and Cloudiness
The temperature of the Schuylkill and Delaware Rivers varied seasonally in 2024 from approximately 34°–91° Fahrenheit. PWD does not treat the water for temperature.

Cloudiness in tap water most commonly happens in the winter, when the cold water from the water main is warmed up quickly in household plumbing. Cold water and water under pressure can hold more air than warmer water and water open to the atmosphere.
When really cold winter water comes out of your tap, it’s simultaneously warming up and being relieved of the pressure it was under inside the water main and in your plumbing. The milky white color is actually just tiny air bubbles. If you allow the glass to sit undisturbed for a few minutes, you will see it clear up gradually.
2025 Data tables
Lead & Copper
Tested at Customers’ taps. Testing is done every 3 years. Most recent tests were done in 2025.
| EPA’s Action Level: For a Representative Sampling of Customer Homes | Ideal Goal (EPA’s MCLG) | 90% of PWD Customers’ Homes Were Less Than or Equal to | Number of Homes Considered to Have Elevated Levels | Range of Tap Sampling Results | Violation | Source | |
|---|---|---|---|---|---|---|---|
| Lead | 90% of homes must test less than 15 ppb | 0 ppb | 2.0 ppb | 1 out of 106 | 0–21 ppb | No | Corrosion of household plumbing; Erosion of natural deposits |
| Copper | 90% of homes must test less than 1.3 ppm | 1.3 ppm | 0.210 ppm | 0 out of 106 | 0.000–0.464 ppm | No | Corrosion of household plumbing; Erosion of natural deposits; Leaching from wood preservatives |
When lead is found in drinking water, it comes from plumbing. Lead can cause serious health problems, especially for pregnant women and young children. Lead in drinking water is primarily from materials and components associated with service lines and home plumbing. PWD is responsible for providing high-quality drinking water and removing lead pipes, but cannot control the variety of materials used in plumbing components in your home. You share the responsibility for protecting yourself and your family from the lead in your home plumbing. You can take responsibility by identifying and removing lead materials within your home plumbing and taking steps to reduce your family’s risk. Before drinking tap water, flush your pipes for several minutes by running your tap, taking a shower, doing laundry, or washing a load of dishes. You can also use a filter certified by an American National Standards Institute-accredited certifier to reduce lead in drinking water. If you are concerned about lead in your water and wish to have your water tested, contact PWD at (215) 685-6300.
Information on lead in drinking water, testing methods, and steps you can take to minimize exposure is available at: www.epa.gov/safewater/lead. Learn more about Lead Plumbing & Water Quality →
Inorganic Chemicals (IOC)
PWD monitors for IOC more often than required by EPA.
| Chemical | Highest Level Allowed (EPA’s MCL) | Ideal Goal (EPA’s MCLG) | Highest result | Range of Test Results for the Year | Violation | Source |
|---|---|---|---|---|---|---|
| Antimony | 0.006 ppm | 0.006 ppm | 0.0007 ppm | 0–0.0007 ppm | No | Discharge from petroleum refineries; Fire retardants; Ceramics; Electronics; Solder |
| Barium | 2 ppm | 2 ppm | 0.043 ppm | 0.024–0.043 ppm | No | Discharges of drilling wastes; Discharge from metal refineries; Erosion of natural deposits |
| Chromium | 100 ppb | 100 ppb | 2 ppb | 0–2 ppb | No | Discharge from steel and pulp mills; Erosion of natural deposits |
| Fluoride | 2 ppm* | 2 ppm* | 0.75 ppm | 0.68–0.75 ppm | No | Erosion of natural deposits; Water additive which promotes strong teeth; Discharge from fertilizer and aluminum factories |
| Nitrate** | 10 ppm | 10 ppm | 5.3 ppm | 0.509–5.3 ppm | No | Runoff from fertilizer use; Leaching from septic tanks; Erosion of natural deposits |
- * EPA’s MCL and MCLG is 4 ppm, but PADEP has set this lower MCL and MCLG which takes precedence.
- ** Nitrate in drinking water at levels above 10 ppm is a health risk for infants of less than six months of age. High nitrate levels in drinking water can cause blue baby syndrome. Nitrate levels may rise quickly for short periods of time because of rainfall or agricultural activity. If you are caring for an infant, you should ask for advice from your health care provider.
- PWD also monitored for Arsenic, Beryllium, Cadmium, Cyanide, Mercury, Nitrite, Selenium, and Thallium in 2025; all results were below respective parameter detection limits.
Radiological Contaminants
Most recent tests were done in 2023.
| Highest Level Allowed (EPA’s MCL) | Ideal Goal (EPA’s MCLG) | Highest result | Range of Test Results for the Year | Violation | Source | |
|---|---|---|---|---|---|---|
| Alpha Emitters | 15 pCi/L | 0 pCi/L | 5.32 pCi/L | 0–5.32 pCi/L | No | Erosion of natural deposits |
Total Chlorine Residual
Continuously monitored at Water Treatment Plants
| Sample Location | Minimum Disinfectant Residual Level Allowed | Lowest Level Detected | Yearly Range | Violation | Source |
|---|---|---|---|---|---|
| Baxter WTP | 0.2 ppm | 2.35 ppm | 2.35–3.51 ppm | No | Water additive used to control microbes |
| Belmont WTP | 0.2 ppm | 1.77 ppm | 1.77–2.82 ppm | No | Water additive used to control microbes |
| Queen Lane WTP | 0.2 ppm | 2.00 ppm | 2.00–3.90 ppm | No | Water additive used to control microbes |
Total Chlorine Residual
Tested throughout the Distribution System. Over 360 samples collected throughout the City every month.
| Sample Location | Maximum Disinfectant Residual Allowed | Highest Monthly Average | Monthly Average Range | Violation | Source |
|---|---|---|---|---|---|
| Distribution System | 4.0 ppm | 2.54 ppm | 1.54–2.54 ppm | No | Water additive used to control microbes |
Secondary Chemicals
| Chemical | EPA’s SMCL | Baxter WTP One Year Range* | Belmont WTP One Year Range* | Queen Lane WTP One Year Range* | Violation* | Source |
|---|---|---|---|---|---|---|
| Chloride | 250 ppm | 53–142 ppm | 67–300 ppm | 76–397 ppm | No | Main component of many salts, may increase in winter months; Erosion of natural minerals; Used in the water treatment process in the form of ferric chloride. |
| Copper | 1.0 ppm | 0.032–0.058 ppm | 0.007–0.036 ppm | 0.023–0.038 ppm | No | Corrosion of copper pipes in premise plumbing; Erosion of natural deposits. |
| Fluoride | 2 ppm** | 0.71 ppm | 0.75 ppm | 0.68 ppm | No | Erosion of natural deposits; Water additive that promotes strong teeth; Discharge from fertilizer and aluminum factories. |
| Iron | 0.3 ppm | 0 ppm | 0–0.016 ppm | 0–0.017 ppm | No | Corrosion of iron water mains and premise plumbing; Erosion of natural minerals; Used in the water treatment process in the form of ferric chloride. |
| pH | 6.5-8.5 | 7.03–7.25 | 7.09–7.34 | 7.12–7.31 | No | Adjusted during the water treatment process. |
| Sulfate | 250 ppm | 6.74–16.7 ppm | 17.90–61.80 ppm | 18.50–54.20 ppm | No | Erosion of natural minerals; Runoff from mining operations. |
| Total Dissolved Solids | 500 ppm | 134–336 ppm | 292–582 ppm | 262–808 ppm | No | Erosion of natural minerals; May increase during winter months due to road salt runoff or during drought conditions. |
- PWD also monitored for Aluminum, Color, Manganese, and Silver in 2025; all results were below respective parameter detection limits.
- * Individual results are averaged monthly and compliance is based on running annual average.
- ** EPA’s MCL and MCLG is 4 ppm, but PADEP has set this lower MCL and MCLG which takes precedence.
Bacteria in Tap Water
Tested throughout the Distribution System. Over 400 samples collected throughout the City each month.
| Highest Level Allowed (EPA’s MCL) | Ideal Goal (EPA’s MCLG) | Highest Monthly % or Yearly Total of Positive Samples | Monthly Range (% of Samples) | Violation | Source | |
|---|---|---|---|---|---|---|
| Total Coliform | No more than 5% of samples can test positive in a single month* | 0 | 0.30% | 0%–0.3% | No | Naturally present in the environment |
| E. coli | 0 | 0.30% | 0%–0.3% | No | Human or animal fecal waste. |
- * Every sample that is positive for total coliforms must also be analyzed for E. coli. If a system has two consecutive total coliform positive samples, and one is also positive for E. coli, then the system has an MCL violation. There were no Level 1 or Level 2 assessments required under the Revised Total Coliform Rule in 2025.
Total Organic Carbon
Tested at Water Treatment Plants
| Treatment Technique Requirement | Baxter WTP One Year Average | Belmont WTP One Year Average | Queen Lane WTP One Year Average | Violation | Source |
|---|---|---|---|---|---|
| Percent of Removal Required | 25–45% | 25–45% | 25–35% | N/A | Naturally present in the environment |
| Percent of Removal Achieved* | 46–69% | 23–63% | 36–72% | No | Naturally present in the environment |
| Number of Quarters out of Compliance* | 0 | 0 | 0 | No | Naturally present in the environment |
- * PWD achieved TOC removal requirements in all quarters of 2025 at all WTPs. Compliance is based on a running annual average computed quarterly. The numbers shown represent a range of TOC results in weekly samples.
Synthetic Organic Chemicals (SOC)
| Chemical | Highest Level Allowed (EPA’s MCL) | Ideal Goal (EPA’s MCLG) | Highest result | Yearly Range | Violation | Source |
|---|---|---|---|---|---|---|
| Atrazine | 3 ppb | 3 ppb | 0.15 ppb | 0–0.15 ppb | No | Runoff from herbicide used on row crops |
PWD also monitored for all SOCs listed in “What we test for and how” in 2025. All results for parameters not shown on this table were below respective parameter detection limits.
Turbidity
A measure of clarity. Tested at water treatment plants.
| Baxter WTP | Belmont WTP | Queen Lane WTP | Violation | Source | |
|---|---|---|---|---|---|
| Treatment Technique Requirement: 95% of samples must be at or below 0.300 NTU | 100% below 0.300 NTU | 100% below 0.300 NTU | 100% below 0.300 NTU | No | Soil runoff, river sediment |
| Highest single value for the year | 0.107 NTU | 0.205 NTU | 0.091 NTU | No | Soil runoff, river sediment |
Disinfection By-Products
| Highest Level Allowed (EPA’s MCL) – Running Annual Average | Running Annual Average 2024* | System-wide Range of Results | Violation | Source | |
|---|---|---|---|---|---|
| Total Trihalomethanes (TTHM) | 80 ppb | 51 ppb | 18–90 ppb | No | By-product of drinking water disinfection |
| 5 Haloacetic Acids (HAA5) | 60 ppb | 41 ppb | 2–86 ppb | No | By-product of drinking water disinfection |
- * Monitoring is conducted at 16 locations throughout the City of Philadelphia.
This result is the highest locational running annual average in 2024.
PFAS
System-wide range of results
| Chemical | Highest Level Allowed (MCL) | Ideal Goal (MCLG) | Highest Result | System Wide Range of Results* | Violation** | Source | ||
|---|---|---|---|---|---|---|---|---|
| EPA*** | PA DEP | EPA*** | PA DEP | |||||
| PFOA | 4 ppt | 14 ppt | 0 ppt | 8 ppt | 6.1 ppt | 2.6–6.1 ppt | No | Discharge from manufacturing facilities and runoff from land use activities. |
| PFOS | 4 ppt | 18 ppt | 0 ppt | 14 ppt | 4.6 ppt | 1.6–4.6 ppt | No | Discharge from manufacturing facilities and runoff from land use activities. |
| PFNA | 10 ppt | N/A | 10 ppt | N/A | 2.6 ppt | 0–2.6 ppt | No | Discharge from manufacturing facilities and runoff from land use activities. |
| PFBS*** | Hazard Index | N/A | Hazard Index | N/A | 6.1 ppt | 1.7–6.1 ppt | No | Discharge from manufacturing facilities and runoff from land use activities. |
| PFHxS | 10 ppt | N/A | 10 ppt | N/A | 1.7 ppt | 0–1.7 ppt | No | Discharge from manufacturing facilities and runoff from land use activities. |
| (HFPO-DA)/GenX | 10 ppt | N/A | 10 ppt | N/A | 0 ppt | 0 ppt | No | Discharge from manufacturing facilities and runoff from land use activities. |
- * Samples were collected on 1/22/2025, 4/14/2025, 7/14/2025, 10/6/2025
- ** Compliance for 2025 was based on Running Annual Averages at each Water Treatment Plant compared to Pennsylvania Department of Environmental Protection’s (PA DEP) MCLs.
- *** Compliance with EPA MCLs and MCLGs begins in 2027
- **** PFBS does not have an individual MCL but is included in Hazard Index calculation
For more information, please see our website: water.phila.gov/PFAS
Unregulated Contaminant Monitoring (UCMR)
| Chemical | Testing Period | Average | Range |
|---|---|---|---|
| PFOA | 1/8/2024–10/7/2024 | 4.6 ppt | 0–8.1 ppt |
| PFOS | 1/8/2024–10/7/2024 | 3.6 ppt | 0–6.0 ppt |
| PFHxA | 1/8/2024–10/7/2024 | 5 ppt | 0–9.1 ppt |
| PFPeA | 1/8/2024–10/7/2024 | 4.9 ppt | 0–9.9 ppt |
| PFBS | 1/8/2024–10/7/2024 | 3.6 ppt | 0–10.0 ppt |
| PFBA | 1/8/2024–10/7/2024 | 2.3 ppt | 0–7.6 ppt |
| PFNA | 1/8/2024–10/7/2024 | 0.8 ppt | 0–4.5 ppt |
| PFHpA | 1/8/2024–10/7/2024 | 1 ppt | 0–3.3 ppt |
In 2024, PWD performed special monitoring as part of the Unregulated Contaminant Monitoring Rule (UCMR), a nationwide monitoring effort conducted by the EPA. Unregulated contaminants are those that do not yet have a drinking water standard set by the EPA. The purpose of monitoring for these contaminants is to help the EPA decide whether the contaminants should have a standard. For more information concerning UCMR, visit these websites: https://www.epa.gov/dwucmr/fourth-unregulated-contaminant-monitoring-rule or https://drinktap.org/Water-Info/Whats-in-My-Water/Unregulated-Contaminant-Monitoring-Rule-UCMR
Unregulated contaminants not detected at any of the sampling locations
11-chloroeicosafluoro-3-oxaundecane-1-sulfonic acid (11Cl-PF3OUdS), 1H,1H,2H,2H-perfluorodecane sulfonic acid (8:2FTS), 1H,1H,2H,2H-perfluorohexane sulfonic acid (4:2FTS), 1H,1H,2H,2H-perfluorooctane sulfonic acid (6:2FTS), 4,8-dioxa-3H-perfluorononanoic acid (ADONA), 9-chlorohexadecafluoro-3-oxanonane-1-sulfonic acid (9Cl-PF3ONS), hexafluoropropylene oxide dimer acid (HFPO-DA)(GenX), nonafluoro-3,6-dioxaheptanoic acid (NFDHA), perfluoro (2-ethoxyethane) sulfonic acid (PFEESA), perfluoro-3-methoxypropanoic acid (PFMPA), perfluoro-4-methoxybutanoic acid (PFMBA), perfluorodecanoic acid (PFDA), perfluorododecanoic acid (PFDoA), perfluoroheptanesulfonic acid (PFHpS), perfluorohexanesulfonic acid (PFHxS), perfluoropentanesulfonic acid (PFPeS), perfluoroundecanoic acid (PFUnA),N-ethyl perfluorooctanesulfonamidoacetic acid (NEtFOSAA), N-methyl perfluorooctanesulfonamidoacetic acid (NMeFOSAA), perfluorotetradecanoic acid (PFTA), perfluorotridecanoic acid (PFTrDA), Lithium
Sodium, Hardness, and Alkalinity in tap water
The parameters listed below are not part of EPA’s requirements and are provided for information purposes.
Sodium in Tap Water
| Baxter WTP One Year Average | Belmont WTP One Year Average | Queen Lane WTP One Year Average | |
|---|---|---|---|
| Average (ppm) | 28 ppm | 55 ppm | 49 ppm |
| Average (mg in 8 oz. glass of water) | 7 mg | 13 mg | 12 mg |
| Range (ppm) | 16–63 ppm | 32–145 ppm | 28–188 ppm |
| Range (mg in 8 oz. glass of water) | 4–15 mg | 7–34 mg | 7–44 mg |
Hardness in Tap Water
| Baxter WTP One Year Average | Belmont WTP One Year Average | Queen Lane WTP One Year Average | |
|---|---|---|---|
| Average | 101 ppm or 6 gpg | 151 ppm or 9 gpg | 169 ppm or 10 gpg |
| Minimum | 72 ppm or 4 gpg | 99 ppm or 6 gpg | 119 ppm or 7 gpg |
| Maximum | 121 ppm or 7 gpg | 204 ppm or 12 gpg | 270 ppm or 16 gpg |
Hardness defines the quantity of minerals, such as calcium and magnesium, in water. These minerals react with soap to form insoluble precipitates and can affect common household chores such as cooking and washing. Philadelphia’s water is considered “moderately hard” or “hard”, depending on your service area.
Alkalinity in Tap Water
| Baxter WTP One Year Average | Belmont WTP One Year Average | Queen Lane WTP One Year Average | |
|---|---|---|---|
| Average | 42 ppm | 76 ppm | 72 ppm |
| Minimum | 23 ppm | 46 ppm | 52 ppm |
| Maximum | 58 ppm | 102 ppm | 95 ppm |
Photography: JPG Photo & Video